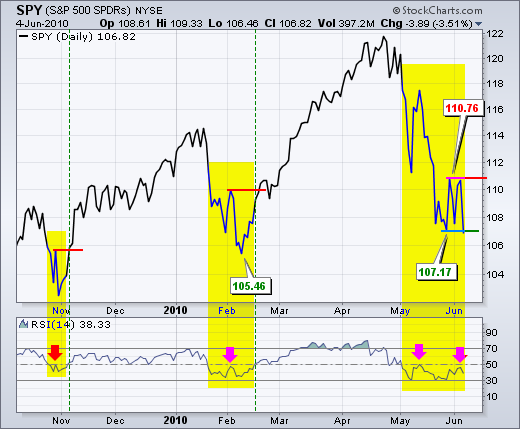
The Relative Strength Index remains below 50 and bearish for the S&P 500 ETF (SPY). Bounded momentum oscillators trade within a defined range. RSI trades between zero and one hundred with fifty as the centerline. Think of this level as the 50 yard line in a football game. The bulls (offense) have the edge when RSI is above 50. The bears (defense) have the edge as long as RSI is below 50. The yellow areas show prior periods with RSI below 50, which correspond with declines. RSI met resistance near 50 during each decline (red arrows). In fact, RSI met resistance near 50 twice during the current decline. Momentum remains bearish as long as RSI is below 50. Look for a break above 50 to turn RSI bullish again.
 Click this image for details
RSI is based on closing prices so I am showing a close-only line chart for SPY. While the most recent decline is obviously the deepest of the three, SPY has yet to close below its February closing low. SPY did, however, close below its late May closing low and this opens the door to a test of the February low. SPY also established a clear resistance level with two closing highs around 110.76. The bears clearly have an edge as long as SPY remains below these resistance levels. A break above these closing highs is needed to reverse the downtrend in SPY.

About the author:
Arthur Hill, CMT, is the Chief Technical Strategist at TrendInvestorPro.com. Focusing predominantly on US equities and ETFs, his systematic approach of identifying trend, finding signals within the trend, and setting key price levels has made him an esteemed market technician. Arthur has written articles for numerous financial publications including Barrons and Stocks & Commodities Magazine. In addition to his Chartered Market Technician (CMT) designation, he holds an MBA from the Cass Business School at City University in London.
Learn More


