A question from a subscriber yesterday prompted me to make a quick review of global markets. I rarely look at global markets because (1) my overriding focus is on the U.S. market and (2) it is my observation that international markets and the U.S. market tend to run in the same direction. There are always exceptions to this rule, but broadly speaking global fundamentals affect nearly all markets and their charts reflect this.
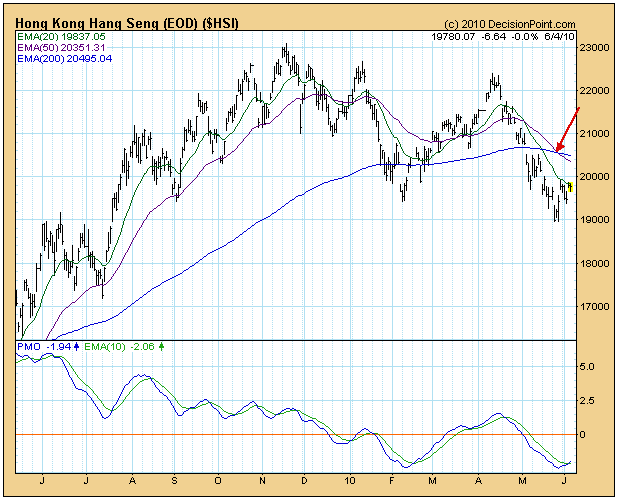
As I review the 20 world market charts on the DecisionPoint website, I see that (with one exception) the 20-EMA is below the 50-EMA, which for the most part has these indexes in a medium-term neutral market posture. There are, however, a few whose 50-EMA has dropped below the 200-EMA, which puts them in a bear market by our rules. Here's an example:
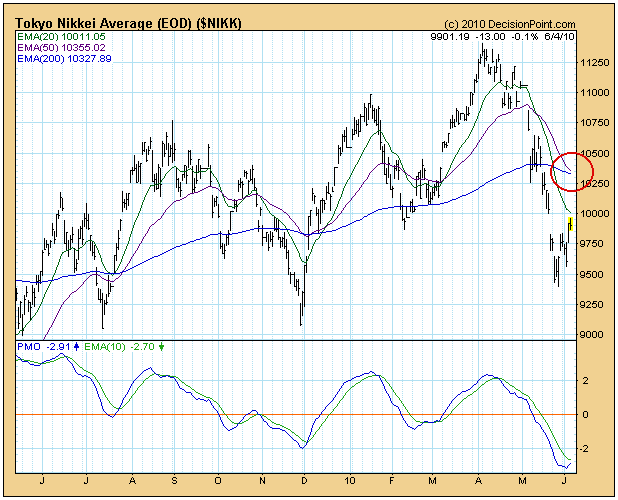
Three other charts are very similar to this one - they are the French CAC, the FSTE Milan Index, and the Shanghai Composite. In addition, the 50/200-EMA crossover has not taken place with the Nikkei yet, but it is virtually guaranteed that it will happen soon.
While most of the charts may agree in directionality with the U.S. market and are showing weakness, it is interesting to note that five of the charts (25%) are showing considerably more weakness than the U.S. market. Unless we believe that the U.S. market will power upward with enough force to drag lagging global markets along, perhaps we should temper any optimism we may have regarding the market's recovery in light of global weakness.
- Carl

About the author:
Carl Swenlin is a veteran technical analyst who has been actively engaged in market analysis since 1981. A pioneer in the creation of online technical resources, he was president and founder of DecisionPoint.com, one of the premier market timing and technical analysis websites on the web. DecisionPoint specializes in stock market indicators and charting. Since DecisionPoint merged with StockCharts.com in 2013, Carl has served a consulting technical analyst and blog contributor.
Learn More


