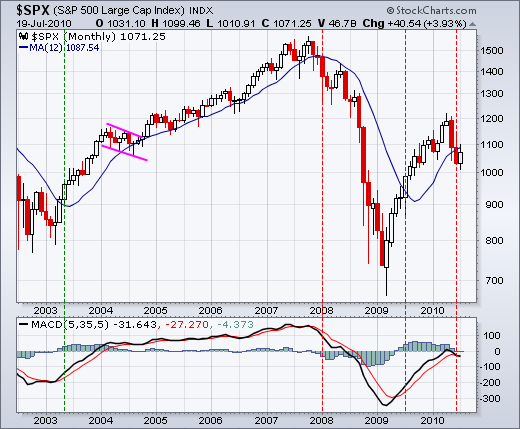
On the monthly chart, the S&P 500 broke below its 12-month moving average for the first time since July 2009. Even though moving average crossovers do not pick exact bottoms or tops, this moving average cross captured the major moves over the last eight years. As with all moving average crossover systems, success depends on a strong trend or sustainable move. A trading range or choppy market will produce whipsaws. For now, the S&P 500 broke below the 12-month SMA with a sharp decline in May-June. This is bearish until proven otherwise. There was a rebound in July, but the index needs to close above 1100 to negate this latest signal.

Click this image for details
The indicator window shows MACD(5,35,5) moving back into negative territory and below its signal line. This is also a long-term bearish development. First, momentum favors the bears when MACD is negative. Second, MACD is also moving lower and getting more negative. A move back into positive territory is needed to turn momentum bullish again. Why use MACD(5,35,5)? Monthly charts are already long-term oriented. Monthly price data is also smoother than daily or weekly price data. Changing the MACD settings from (12,26,9) to (5,35,5) increases sensitivity.

About the author:
Arthur Hill, CMT, is the Chief Technical Strategist at TrendInvestorPro.com. Focusing predominantly on US equities and ETFs, his systematic approach of identifying trend, finding signals within the trend, and setting key price levels has made him an esteemed market technician. Arthur has written articles for numerous financial publications including Barrons and Stocks & Commodities Magazine. In addition to his Chartered Market Technician (CMT) designation, he holds an MBA from the Cass Business School at City University in London.
Learn More


