ChartWatchers

STOCK INDEXES BREAK DAILY DOWNTREND

John Murphy

John Murphy

Chief Technical Analyst, StockCharts.com

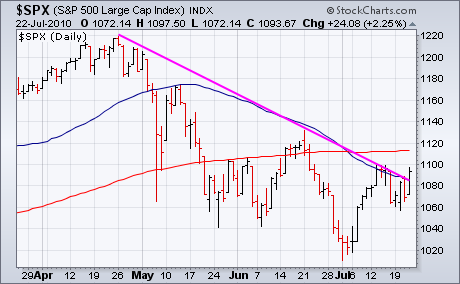
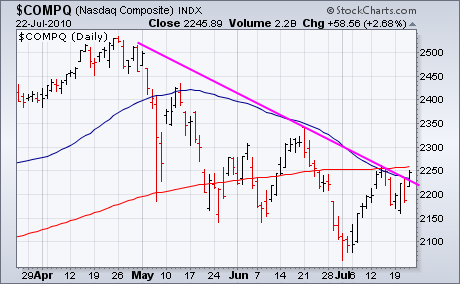
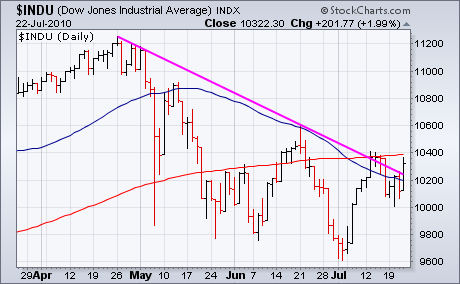
Stocks turned in a strong performance Thursday. The three major stock indexes shown below closed back over their 50-day moving averages. The S&P 500 (Chart 2) and the Nasdaq Composite (Chart 3) did so for the first time since early May. Another positive sign is the ability of all three indexes to close above the down trendline drawn over their April/June highs. The next hurdle to overcome is their July highs and 200-day moving averages. The short-term stock picture does appear to have improved with the growing possibility of a rebound to the mid-June peak. The rally in stocks was supported by a rally in most commodities, most notably copper prices which hit a three-month high.

20100722009-sc
20100722010-sc
20100722011-sc

John Murphy
About the author: is the Chief Technical Analyst at StockCharts.com, a renowned author in the investment field and a former technical analyst for CNBC, and is considered the father of inter-market technical analysis. With over 40 years of market experience, he is the author of numerous popular works including “Technical Analysis of the Financial Markets” and “Trading with Intermarket Analysis”. Before joining StockCharts, John was the technical analyst for CNBC-TV for seven years on the popular show Tech Talk, and has authored three best-selling books on the subject: Technical Analysis of the Financial Markets, Trading with Intermarket Analysis and The Visual Investor. Learn More