Divergences are among the most misused technical analysis tool anywhere, in my opinion. The first step in successful trading using divergences is understanding both their strengths and their limitations. My preference is to focus on divergences as they relate to the Moving Average Convergence Divergence (MACD). Others use divergences on bound momentum oscillators like the RSI and stochastics. The word "bound" refers to the physical limitations of both of these oscillators. They cannot print a reading higher than 100 nor lower than 0. That's a fact. By definition, a "positive" divergence occurs when you have lower equity prices and a higher oscillator reading. So think about this for a minute. If a stock is selling off and prints a stochastics reading of 0, what is the likelihood that stochastics will be lower the next time prices move to new lows? I'd say there's a 0% chance. So if prices do move lower, you're guaranteed to have a positive divergence. To me, that's an absolutely worthless piece of technical evidence. RSI is also a bound oscillator, but it rarely moves below 20 or above 80. Therefore, it's a bit more reliable in terms of suggesting slowing momentum. I may check the divergence on the RSI occasionally, but it's never a primary indicator for me.
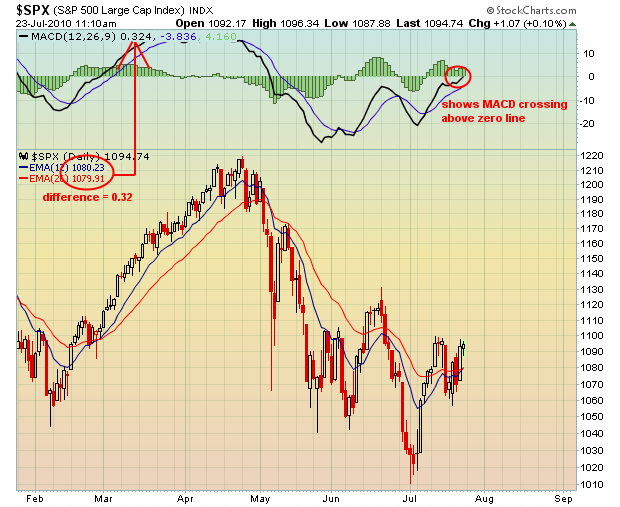
That brings me to the MACD. Let's start with the definition. The MACD is the difference between any two moving averages. Are they converging (moving closer together) or diverging (moving further apart)? It gives us a sense of momentum in an underlying stock or index. The "standard" MACD is the difference between the 12 period EMA and the 26 period EMA. StockCharts allows the printing of a simple chart to provide the calculation. Check out this S&P 500 daily chart:

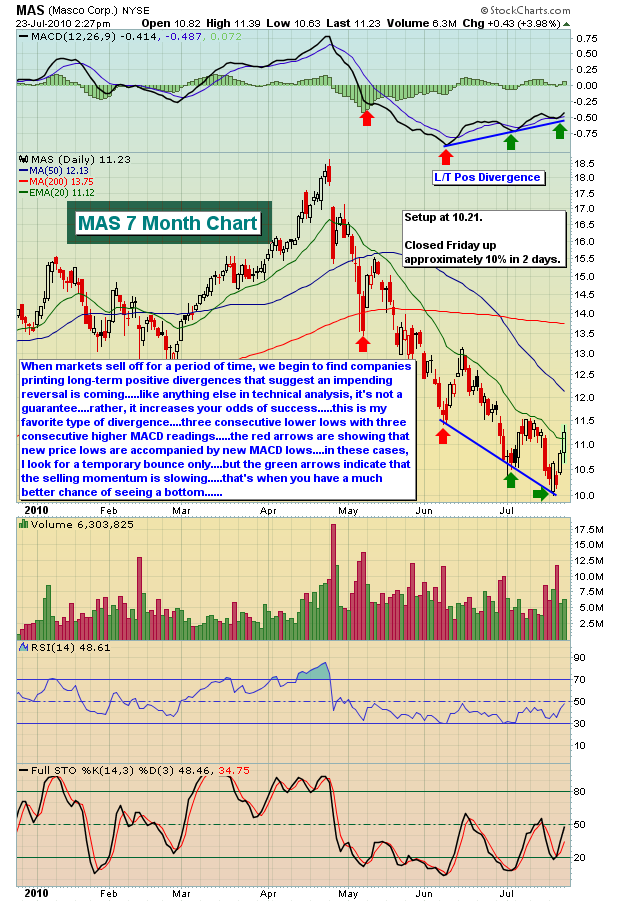
As prices move higher or lower, it's very typical for the shorter-term moving average to change more abruptly in the direction of price. But after a period of rising or falling prices, the difference between these moving averages begin to "converge" and that's the signal that momentum is shifting. While many technical indicators lag, the long-term positive and negative divergences that form on the MACD actually precede trend reversals. Last Tuesday, we issued three stock setups and one was flashing a buy signal based on a long-term positive divergence that had formed. Take a look below at the result since:

There are definitely rules to follow when buying a stock with a positive divergence or selling one with a negative divergence. If you're interested in divergences and would like to learn more about them, feel free to join me on Tuesday, July 27th as I lead the fourth in our monthly Online Traders Series events. CLICK HERE for more details on this event and for additional trading candidates with long-term positive divergences currently present.
We are also featuring another stock with a powerful long-term positive divergence in place as our Chart of the Day for Monday, July 26. CLICK HERE for more information.
Happy trading!
That brings me to the MACD. Let's start with the definition. The MACD is the difference between any two moving averages. Are they converging (moving closer together) or diverging (moving further apart)? It gives us a sense of momentum in an underlying stock or index. The "standard" MACD is the difference between the 12 period EMA and the 26 period EMA. StockCharts allows the printing of a simple chart to provide the calculation. Check out this S&P 500 daily chart:

As prices move higher or lower, it's very typical for the shorter-term moving average to change more abruptly in the direction of price. But after a period of rising or falling prices, the difference between these moving averages begin to "converge" and that's the signal that momentum is shifting. While many technical indicators lag, the long-term positive and negative divergences that form on the MACD actually precede trend reversals. Last Tuesday, we issued three stock setups and one was flashing a buy signal based on a long-term positive divergence that had formed. Take a look below at the result since:

There are definitely rules to follow when buying a stock with a positive divergence or selling one with a negative divergence. If you're interested in divergences and would like to learn more about them, feel free to join me on Tuesday, July 27th as I lead the fourth in our monthly Online Traders Series events. CLICK HERE for more details on this event and for additional trading candidates with long-term positive divergences currently present.
We are also featuring another stock with a powerful long-term positive divergence in place as our Chart of the Day for Monday, July 26. CLICK HERE for more information.
Happy trading!

About the author:
Tom Bowley is the Chief Market Strategist of EarningsBeats.com, a company providing a research and educational platform for both investment professionals and individual investors. Tom writes a comprehensive Daily Market Report (DMR), providing guidance to EB.com members every day that the stock market is open. Tom has contributed technical expertise here at StockCharts.com since 2006 and has a fundamental background in public accounting as well, blending a unique skill set to approach the U.S. stock market.
Learn More