Looking at a weekly chart of the U.S. Dollar Index we can see that it entered a steep correction off the June top when it encountered long-term resistance from a declining tops line reaching back to 2006. During the correction a rising trend line drawn from the December 2009 low was violated, and it seemed likely that the index would decline all the way back to the long-term rising trend line drawn across the 2008 and 2009 lows. That may still happen, but currently a snapback rally has begun.
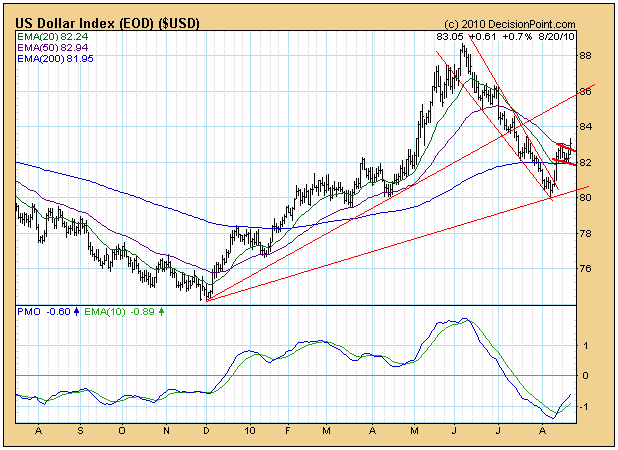
When a line of support is violated, shortly after the breakdown the technical expectation is that prices will snap back up toward the point of breakdown. The daily chart below gives a closer view of the action and of the bullish flag formation that has formed. We can see the sharp up move that broke through the declining tops line (flag pole), and for the last week the price index has been consolidating in a tight, downward-slanting trading range (flag).
While the expectation of a snapback rally has been fulfilled, the flag formation implies that the index will continue to rally -- today there was a breakout from the flag. The price projection equal to the length of the flag pole is about 85.
As of 7/14/2010 the US Dollar is on a Trend Model neutral signal. A new buy signal will be generated when/if the 20-EMA crosses up through the 50-EMA.
Bottom Line: After over two months of decline, the Dollar Index is rallying and looking bullish for the short-term; however, there is a rising trend line above that will present resistance, and the longer-term picture on the weekly chart shows a PMO that is falling below its EMA. My best guess at this point is that the rally will continue for a time, but that it will eventually fail and that the longer-term decline will continue down to long-term support -- around 76 on the long-term rising trend line.


