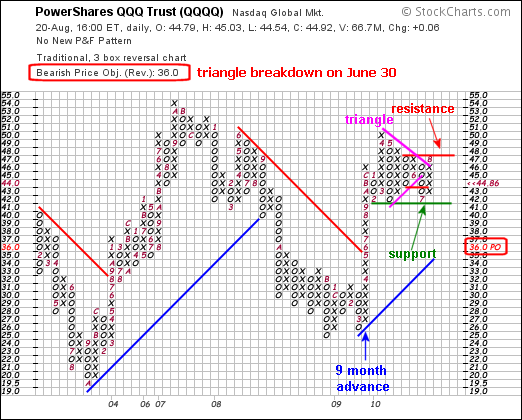
The current P&F signal is bearish. A triangle formed from January to June and the ETF broke triangle support in late June. This break is denoted with the black "o" just above the red 7, which marks the start of July. This bearish P&F signal has yet to be negated and the current price objective is 36. It would take a move above 48 to forge a double top breakout and reverse the current bearish signal. In fact, a break above 48 would make this pattern looks like a large pennant, which is a bullish continuation pattern.
Even with a bearish price objective, QQQQ is still holding major support around 41-42. Notice how the ETF bounced off this level in February, May and July. A move below this support level would forge a quadruple bottom support break and call for a new downside price objective. See our ChartSchool for details on P&F charting techniques (click here) and P&F alert patterns (click here). Chart annotations were done with a separate drawing program.


