Let's do a case study.
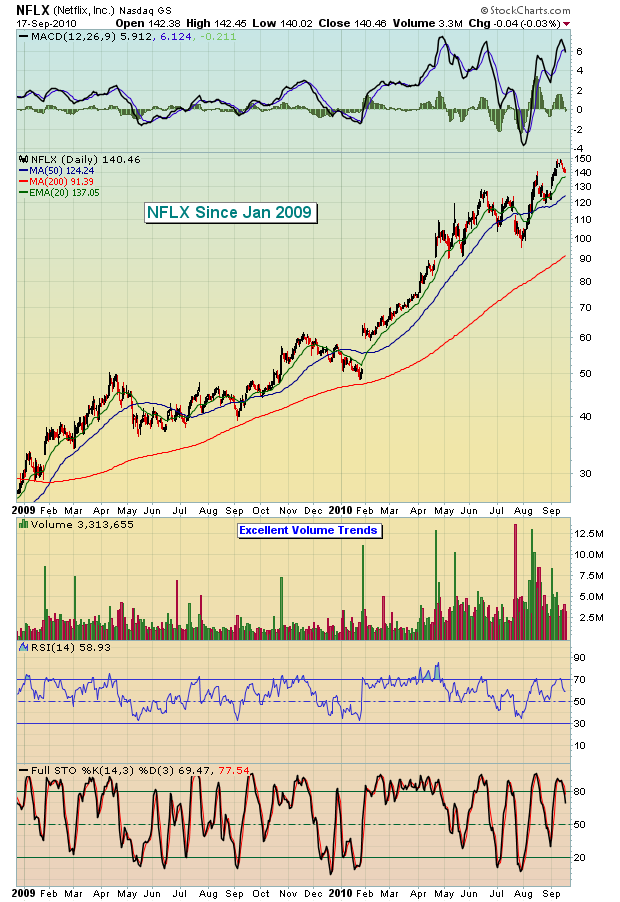
Wouldn't it be great to find the next Google (GOOG) or Apple (AAPL) in the early stages, before the meteoric rise? It's definitely possible, but it takes homework and TONS of patience. Every great long-term performer goes through similar breakout stages. They will base, many times for long stretches, before another breakout occurs. They tend to be strong relative performers, meaning they tend to base when the market breaks down and soar during market advances. Occasionally, they even flat out break down before later resuming their march higher with a vengeance, or what I like to call an "exclamation point". Let's use Netflix (NFLX) as our case study. Since the beginning of 2009, NFLX has risen 400% from $30.00 to $150.00. It hasn't been straight up every day, though, as there have been plenty of bumps along the way. First, look at the overall performance:
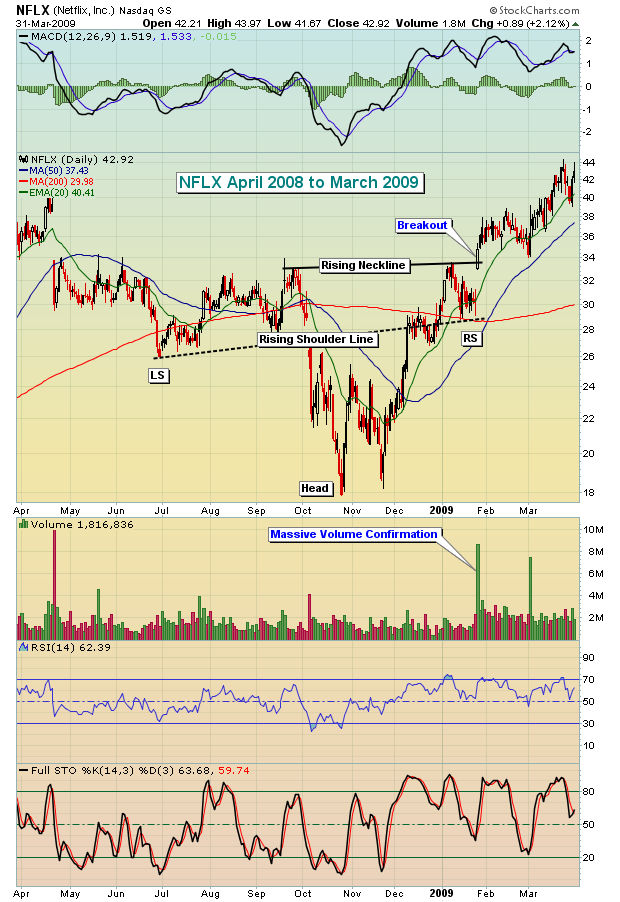
While everyone wants to be in at the bottom, what were the key signs that suggested that this type of advance might be possible? Well, check out the action just before this impressive rise began:
NFLX was downtrending aimlessly. It certainly was emanating few signs of a potential blockbuster move to the upside. But then came THE pattern. It was simple enough - a potential bottoming head & shoulders pattern. The key part of these technical patterns, however, isn't the formation, but the "firmation", as in CONfirmation. That occurs when the volume on the breakout leaves you breathless. You don't have to wonder if the volume is of the "confirming" variety. It's quite apparent. NFLX broke out in January 2009 and that set the stage for what we've witnessed since - one of the best performing stocks for two years running.
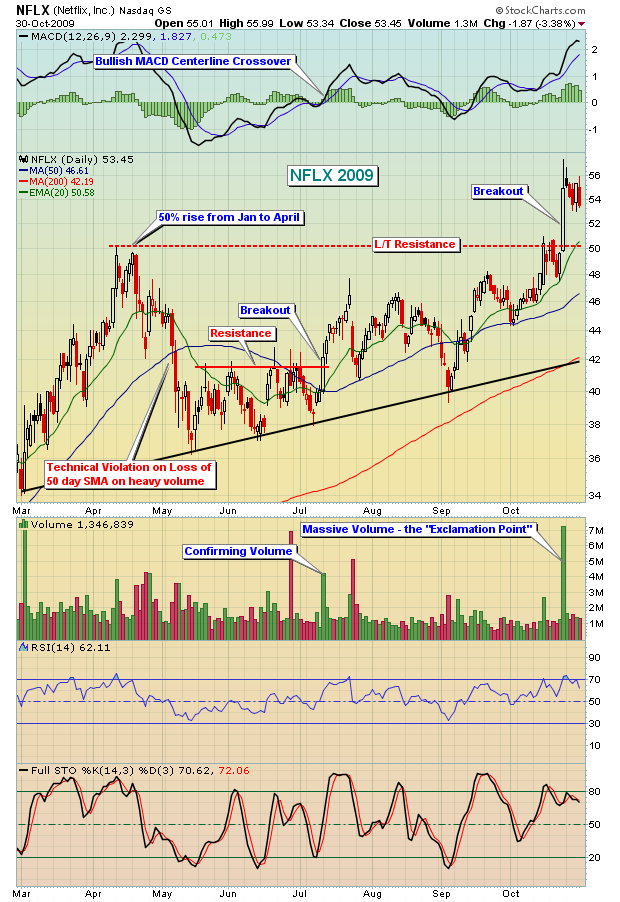
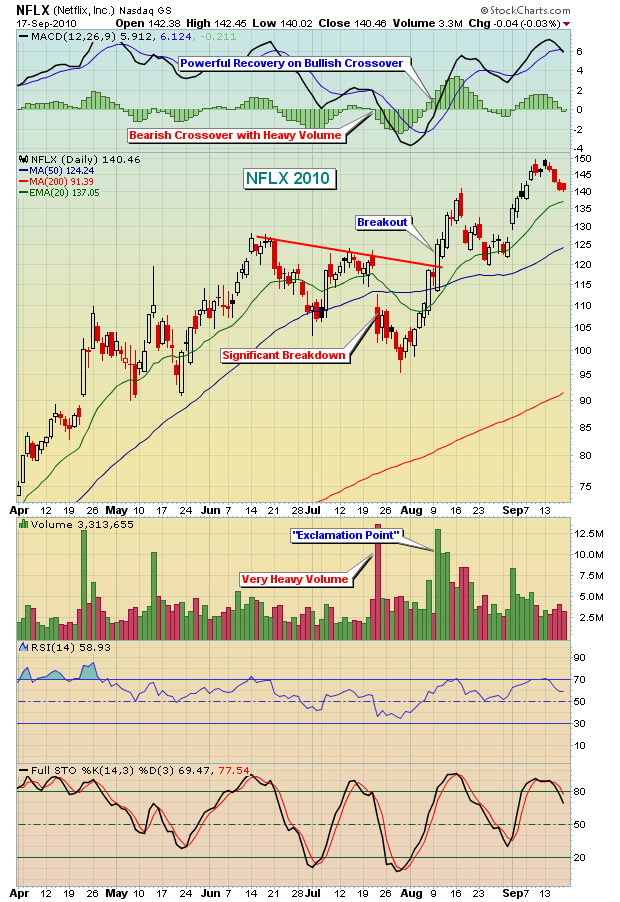
NFLX has had its periods of ho-hum action and even breakdowns, but each such period has been followed up with that "exclamation point" move back to the upside. Check out the next two charts, one in 2009 and one in 2010, that shows the potential breakdowns and the explosive recoveries:
The truly strong stocks don't leave you wondering whether a move is for real. It's evident with exclamation points on the chart. The combination of price action and accompanying volume is BY FAR my #1 indicator. It trumps everything else. Institutions cannot accumulate stocks without volume spikes and stocks cannot become superstars without price appreciation. The two go hand-in-hand.
For Monday, September 20, 2010, we're featuring a small cap stock for our regular Chart of the Day that "could" be at the stage NFLX was back in early 2009. A bottoming head & shoulders pattern formed and an "exclamation point" was delivered on Wednesday with a retest of the breakout area on Friday. CLICK HERE for more details.
Happy trading!


