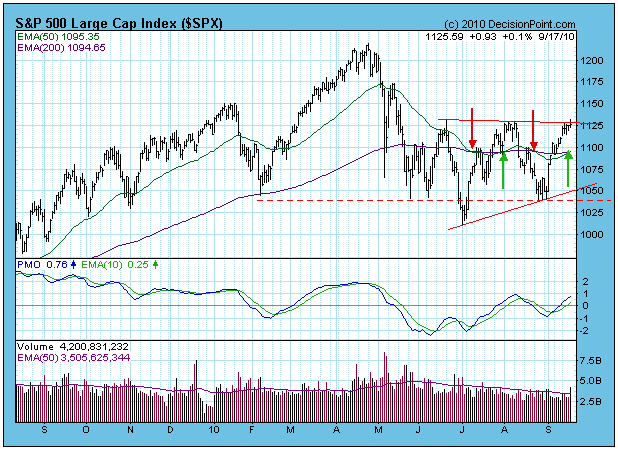
Today another long-term buy signal was generated when the S&P 500 Index 50-EMA crossed up through the 200-EMA. Normally, we have high confidence in these signals, but, unfortunately, the long-term model has generated four, count 'em, four "long-term" signals in less than three months. On the chart below the red arrows mark the sell signals and the green arrows the buy signals. Prices have entered a trading range and, as you can see, they move just far enough in one direction to trigger a signal, then they reverse and go just far enough in the opposite direction to trigger the reverse signal.
This is not typical of how the model usually works, but any mechanical model will eventually run into rough patches where peculiar price movement defeats them. This is one of those times, and as long as the 50-EMA keeps making these shallow cuts back and forth, our confidence in the signals will not be robust.
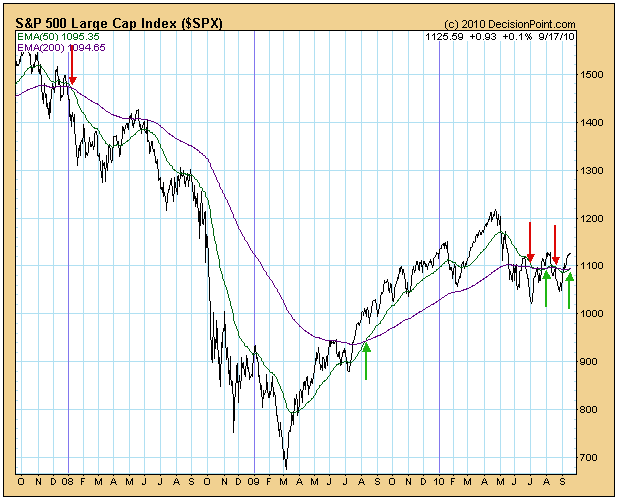
The chart below shows a three-year time frame, and the first two signals (sell in January 2008; buy in August 2009) are what we would classify as normal. Note that the 50/200-EMA cuts are relatively steep and are quickly confirmed by price movement.
Our long-term signals are used primarily to identify the long-term trend of the market so as to have a context within which to make decisions in the intermediate-term time frame. Nevertheless, we expect the model to have a profitable record over time, and it does. See our Timer Digest rankings rankings through the link on this page or on the website.
Bottom Line: The question now is how much faith do we put in this new buy signal. Since it is a buy signal, I would say that it gives the bulls a slight advantage, but my confidence will really blossom when prices break through the overhead resistance at about 1130 that has stopped progress three times since June.


