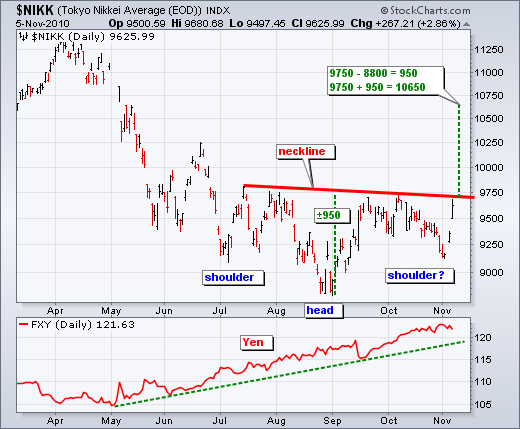
Although a little late to the party, the Nikkei 225 ($NIKK) is showing signs of life with an inverse head-and-shoulders pattern taking shape. Note that the S&P 500 formed an inverse head-and-shoulders from mid May to mid September and broke resistance in the second half of September. The Nikkei continued to a new low in late August, but forged a higher low in early November to form the right shoulder. The chart below shows the left shoulder forming in July and the head in late August. With the global rally in stocks, the Nikkei surged to neckline resistance with a strong move the last two days. This reversal pattern would be confirmed with a neckline break, but I am marking a resistance zone around 9750 based on the neckline and October high. A break above the October high would complete the pattern. According to classic technical analysis, the distance from the neckline to the August low (head) is added to the breakout for a target. This targets a move to around 10650.

Click this image for a live chart


