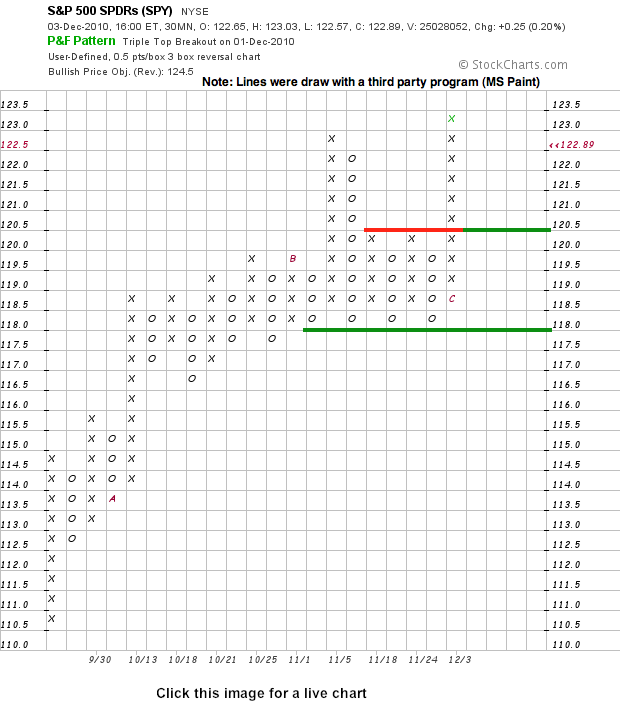
Point & Figure produce straight-forward charts that focus exclusively on price action. Columns of X's appear during an advance. Columns of O's appear during a decline. Nothing appears when prices are flat or move less than the box size or reversal amount. Point & Figure charts are especially good for identifying support and resistance levels. The chart below shows a 30 minute S&P 500 ETF (SPY) Point & Figure chart**. Each box represents 50 cents and this is a normal 3 box reversal chart. This intraday chart goes back to mid September. The red A signals the start of October, the red B shows the start of November and the red C marks the start of December (most recent column).

From this chart, we can identify two support levels to watch. First, the ETF broke resistance at 120.5 with the surge over the last few days. Broken resistance at 120.5 now turns into the first support level to watch. A strong breakout should hold. A move below this level would suggest the bulls are getting cold feet. Just below 120.5, we can see a more important support level at 118. Four columns of O's reversed off this level in November. A break below these lows would be a bearish development.


