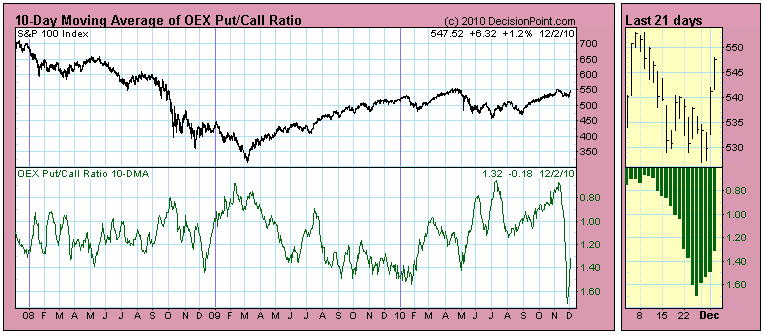
Last week some subscribers asked me what was going on with the OEX Put/Call Ratio. You can see on the 10-Day Moving Average chart that it took a sharp dive off the November price top. (Actually the ratio reading went higher, but we reverse the scale to make oversold readings visually more intuitive.)
I verified that the data were correct, but I drew a blank as to why the indicator was behaving as it was. In fact, I don't follow put/call ratios closely because I find they are hard to interpret, so I had to let it simmer on the back burner for a few days until it came to me. Now I will belatedly explain what I think happened.
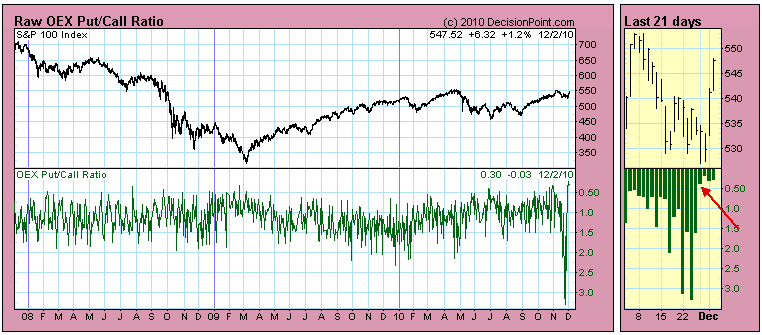
OEX options are one of the instruments that money managers use to hedge their portfolios. When the market began correcting in November, the big money started hedging with OEX puts on a very large scale. Once the rally started, things rapidly got back to normal. Well, in fact, things got back to normal just a little bit before the rally began. The chart below shows the raw daily ratio (not smoothed as a moving average). Note on the thumbnail chart on the right how the ratio went back to the opposite extreme just two days before the rally breakout occurred. Isn't that amazing?
Bottom Line: The OEX Put/Call Ratio is one way to get an idea what the big money is doing because OEX options are one of the instruments used for hedging. The fact that the ratio reached such extremes demonstrates how much concern there was about the progress of the correction. The fact that this represented bearish sentiment of the so-called smart money could have been misleading -- they tend to get it right -- but in this case a negative outcome did not materialize. The real news is how that negative sentiment evaporated shortly before the market actually began to rally. It makes one wonder what happened to cause them to change their mind.


