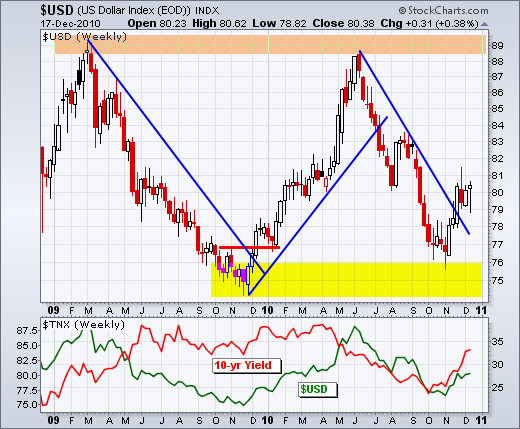
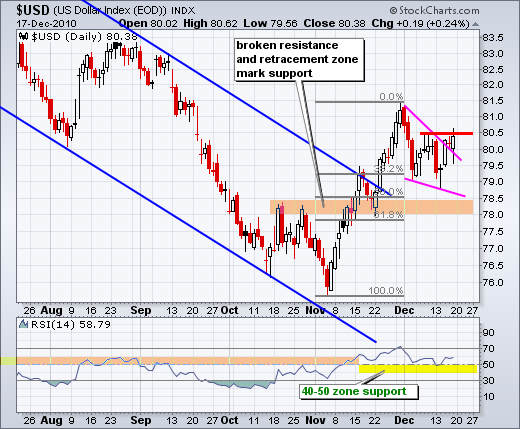
The US Dollar Index ($USD) remains within a long-term trading range, but the swing within that range is up after the November breakout. More importantly, the breakout is holding and rising rates are boosting the greenback. The first chart shows the US Dollar Index with resistance in the 88-89 area and support in the 74-76 area. There are also three big swings on this chart marked by the blue trendlines. With the recent surge above 80, the index broke the June trendline to start an upswing within this trading range. The indicator window shows the Dollar and the 10-year Treasury Yield. Notice how the yield bottomed ahead of the Dollar and moved sharply higher the last 2 1/2 months. Despite problems with the deficit, rising rates are a positive influence on the Dollar. The second chart shows the US Dollar Index breaking a wedge trendline and challenging resistance around 80.50 this week.

Click this image for a live chart


