Bonds are in a "waterfall" decline, and some people are beginning to wonder where the bottom will be. A subscriber comments: "I'm always anxious to see the reaction time of the DP Trend Model as compared to what I look for in the momentum of the primary trend. You're doing a fine job with equities explaining what you see when you look at the other indicators and would love to see you give a little more attention to the bonds. I'd be able to follow what indicators you use to evaluate the oversold point in this waterfall. Yes, I'm aware of the falling knife adage and would not go long but rather stop being short. Perhaps go short after the relief rally. Depends on where the dollar is in it's move as well."
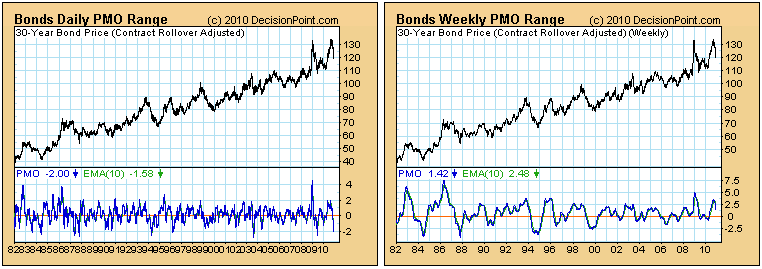
To begin let's estimate overbought/oversold conditions. Below are two charts that show the daily and weekly PMO in relation to their 30-year ranges. The daily PMO (on the left) is clearly at the bottom of its normal range and is oversold. It still has room to go lower, much, much lower, but it would be reasonable to start looking for a price bottom. The weekly PMO, however, has topped in overbought territory and has plenty of room to go downward before it becomes oversold. Conclusion: A medium-term bounce is possible, but the longer-term decline has a long way to go.
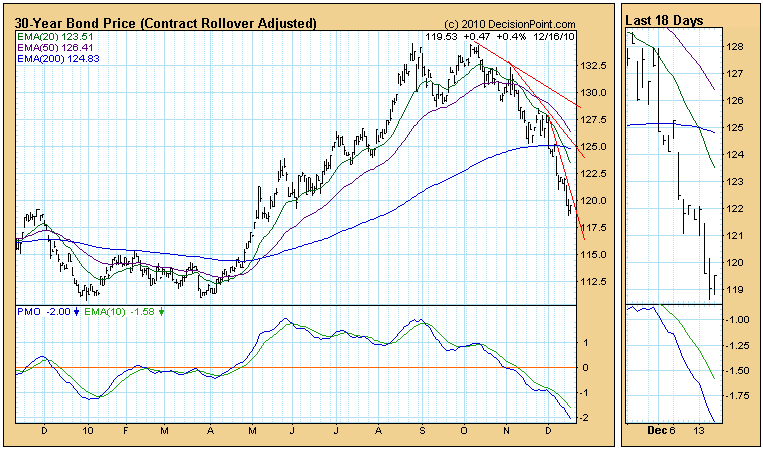
Next, let's take a look at the daily chart, which is where we get the best view of the Trend Model components -- the 20-EMA and 50-EMA. The model will generate a buy signal when there is a 20/50-EMA upside crossover, and I can tell you that, while price will probably turn on a dime, the Trend Model will not. It is going to take a lot of upside movement to get the model to turn when the down trend is this accelerated.
The model is currently in neutral, so we don't have to worry about being short and getting caught in a vicious upside reversal, but for those who are short, the problem is when to cover shorts, not when to go long. Two possible signals that could be used are (1) when the PMO turns up, or (2) when the steepest declining tops line is penetrated to the upside.
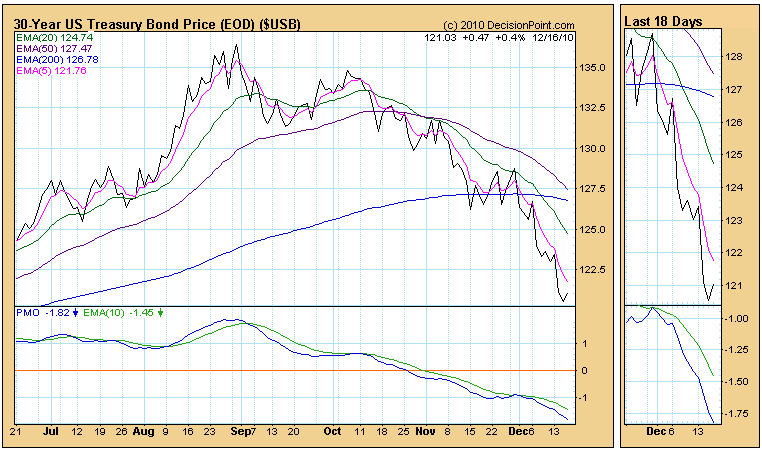
As I said, the Trend Model will be slower to generate a buy signal than some people will like. For those managing positions in the short term, two possible buy signals are (1) the PMO crossing up through its EMA, or (2) the 5-EMA crossing up through the 20-EMA. The 5/20-EMA relationship is something we are going to be paying closer attention to in the future, so let's take a look at a short-term chart.
The movement of the 5-EMA can provide a clear picture when the PMO is presenting a fuzzy one. Note how it remained above the 20-EMA during the June/July/August period, while at the same time the PMO was inscrutable. PMO signals during that time were not helpful at best, but the 5-EMA said "stay long".
As for a 5/20-EMA buy signal for bonds, the amount of separation between the moving averages tells us that it will still take a lot of rally before it happens, so it won't be the most timely of signals. This is always a byproduct of steep declines.
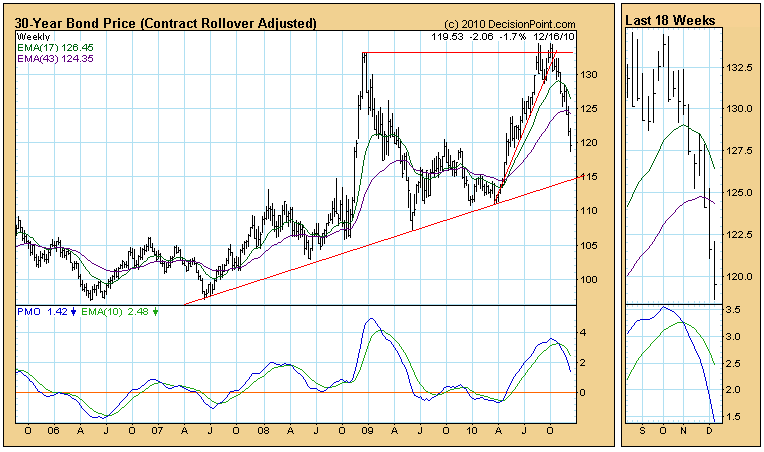
The weekly chart shows long-term support on the rising trend line drawn from the 2007 lows.
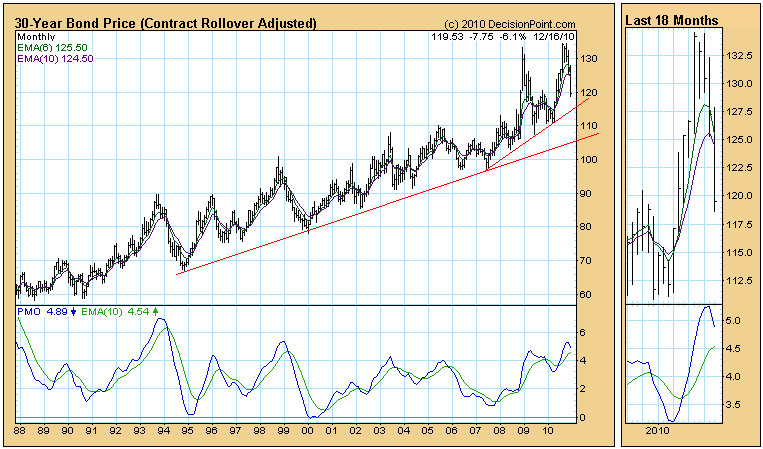
But the monthly chart shows the very long-term support on the rising trend line, as well as the potential downside if that support is broken.
Bottom Line: Bonds are in a long-term bear market based upon the fact that the 50-EMA is below the 200-EMA. The current steep decline is subject to being reversed rather abruptly, so shorts should have a plan to cover quickly; however, I don't think that the long-term decline is over, and I wouldn't be anxious to be long on other than a short-term basis.

