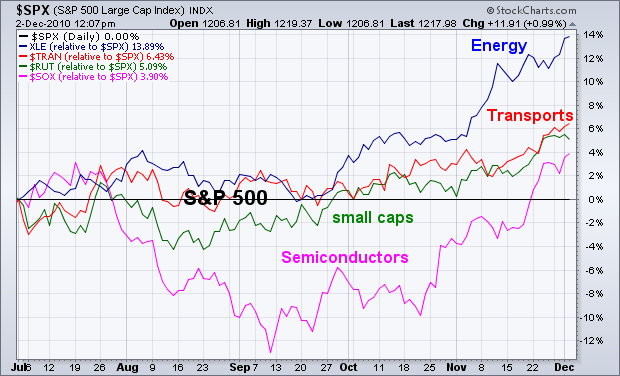
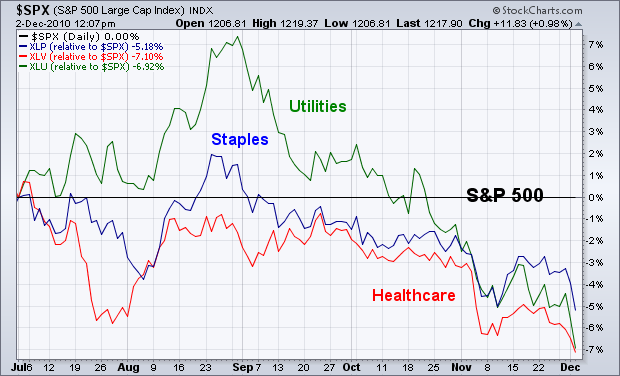
A way to determine whether or not investors are turning more optimistic on the economy (and stock market) is to study the trend of recent sector rotations. In an improving economy, investors tend to favor economically-sensitive stock groups. In a weakening economy, they favor defensive stock groups. The charts below reflect a much more upbeat mood on the American economy. The first chart shows relative strength lines for four economically-sensitive stock groups since midyear, and show all four groups rising faster than the S&P 500 (flat black line). In order of strength, they're energy, transports, small caps, and semiconductors. It's always a good sign when those groups are leading the market higher. By contrast, the second chart shows the three weakest groups since August to be healthcare, utilities, and consumer staples. Investors rotate out of those defensive stock groups in a strengthening economy.


