Complacency was the big issue for stock market bulls as we entered the second week of November. The market simply ran too far too fast and everyone began piling in on the equity calls as if the buying would never end. Well, guess what? The buying ended! The market topped on November 9th, while complacency (which I define by our proprietary relative complacency ratio) peaked on November 10th. The warning signs began to mount on November 5th. This usually sends us into our trading shell, risking very little in terms of capital. Individual trades on a case-by-case basis is fine, but risking an entire portfolio on the long side without hedges makes little sense during times like that. From the NASDAQ's top on November 9th, it fell 133 points, or roughly 5%, over the next 5 trading days. I prefer missing out on that type of pullback if at all possible.
That selling was healthy for the market, however, as the Dow Jones and S&P 500 both tested their respective 50 day SMAs for the first time since breaking above those key moving averages in early September. In the case of the Dow Jones, a long-term negative divergence had formed in early November, suggesting the 50 day SMA test was likely to "reset" the MACD back at the centerline.
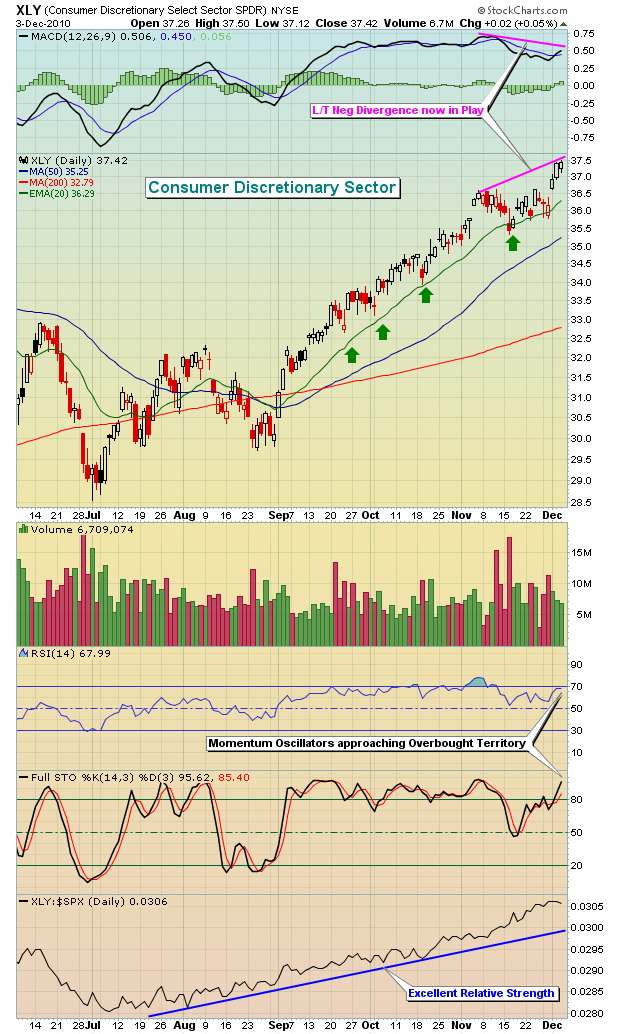
So where does the market likely go from here? Well, I remain cautiously bullish. Energy and consumer discretionary stocks were the leading sectors in November, but both are sporting nasty long-term negative divergences. Check out the chart on the XLY (ETF that tracks consumer discretionary stocks):
The negative divergences in key sectors like consumer discretionary and energy are likely to result in more rotation. As momentum slows in these two groups, selling normally accelerates and cash is redeployed to other sectors. Materials was a major beneficiary last week and I believe that group and technology, industrials, and financials could benefit in the week(s) ahead.
If you'd like more information on the MACD (Moving Average Convergence Divergence), I will be hosting two FREE events on Tuesday, December 7th. During this presentation, I'll explain exactly what the MACD is, why it works and how we use it. It will be a great refresher for those who already use the MACD and a great learning tool for those interested in developing better trading skills. To register, CLICK HERE.
I'll also be featuring the XLE's (an ETF that tracks the energy sector) negative divergence as our Chart of the Day for Monday, December 6th. CLICK HERE for more details.
Happy trading!


