For the first time since August 2010, the bears are in control of the short-term action. I haven't lost sight of the intermediate- and long-term uptrends that are in place (which remain bullish), but I also am not going to ignore the clear breakdowns of the past few weeks on heavy volume.
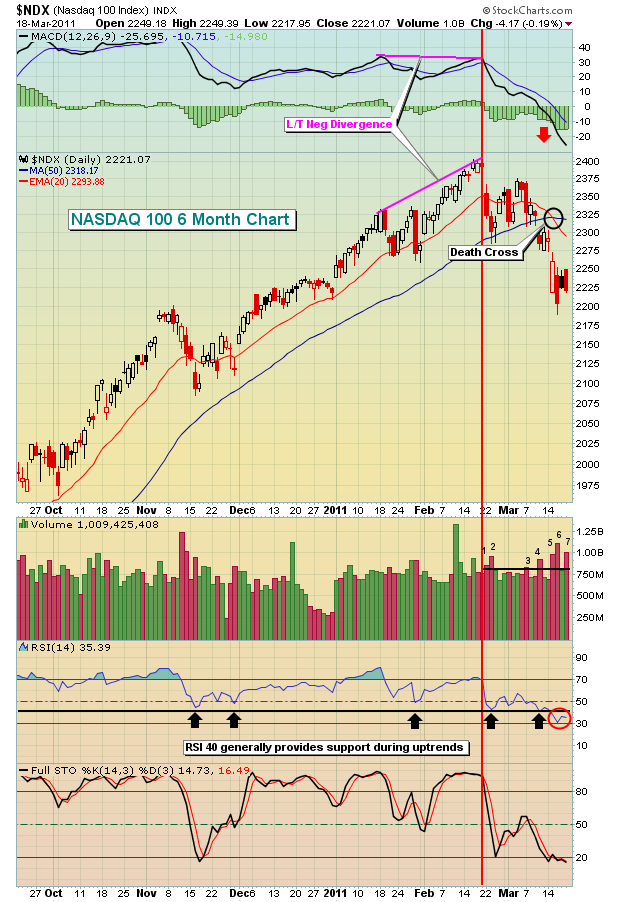
Perhaps the most bearish indication has been the impulsive nature of the selling. Below is a chart of the NASDAQ 100:

There are a few things to point out here. First, this is a 6 month chart showing that the near-term technicals have eroded. Longer-term weekly charts remain quite bullish. Long-term charts cannot breakdown without the shorter-term charts breaking down first. With that in mind, let's take a look at a few of the issues the bulls will need to address in the very near-term.
The combination of price/volume is the most significant piece of technical evidence in my opinion. It trumps EVERYTHING else. It's very difficult to take a bullish view on the price/volume combo since mid-February. I've drawn a vertical red line to separate what was solid price/volume trends from the more bearish trend we've seen over the past month. Since the downtrend began, the 7 highest volume days on the NDX have all been down days. 5 of those 7 days have had closes more than 1% below opens. This demonstrates that there's plenty of distribution taking place throughout the trading day. It's not simply a gap down and the weakness is over. Those big red candlesticks tell a scary story.
The weakness was preceded by a long-term negative divergence on the MACD. That was a warning sign that momentum was beginning to slow. The subsequent MACD centerline cross was followed by a death cross (black circle in chart above). These are unmistakable signs that the bears are now in control. It was hard to dispute the fact that the bulls were in control for 6 months. Well, now it's the bears' turn.
Another red flag raised last week was the RSI falling beneath the 40 support level. While 30 marks oversold conditions, 40 has proven to be a fairly reliable RSI support level during uptrends if you study history. This just adds to the bearish short-term argument.
Determining whether market weakness simply represents a pullback or whether it is the start of a bear market is the subject of this month's Online Traders Series event. CLICK HERE for details.
I am very pleased to announce the launch of our Traders Boot Camp series, which is a FREE learning series on a wide range of topics associated with trading stocks. To register, CLICK HERE.
Happy trading!


