Hello Fellow ChartWatchers!
Talk about your "Wall of Worry"! These days there are tons of things to worry about. So are the bulls going to be able to keep climbing?
Whenever I want to get a solid, high-level view of the overall market I turn to our trusty Bullish Percent Indexes. Specifically the Bullish Percent Indexes for the nine S&P Market Sectors.
Remember, a Bullish Percent Index (BPI) takes a group of stocks and records the percentage of those stocks that have a "P&F Buy" signal on their Point and Figure charts. So BPI's are market indicators that range between 0 and 100 and give you a great sense of how bullish or bearish that group of stocks is.
We currently have BPIs for 19 different groups. Here's the complete list. Note that our BPI's always have ticker symbols that start with "$BP".
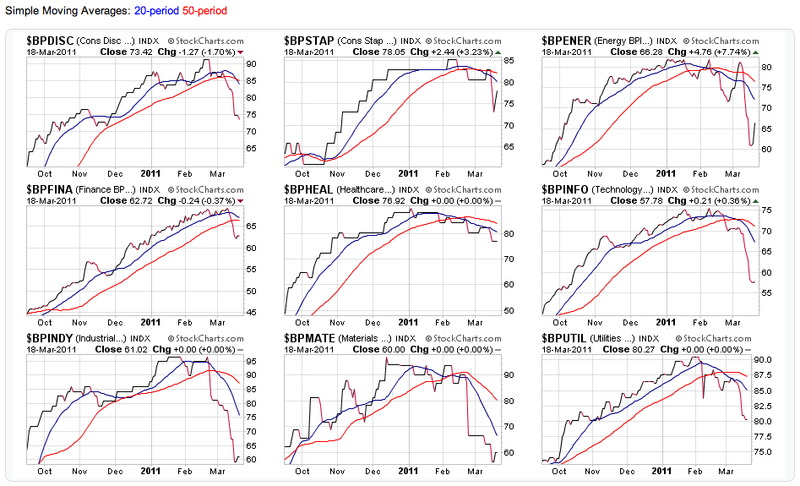
The nine S&P Sector BPI's are created from the members of the nine S&P Sector ETFs. They provide a broad view of the market as a whole and can help spot sector rotation effects. In the case of their BPI's, our CandleGlance tool is perfect to seeing how these BPI's are doing:
(Click above to see live versions of these charts.)
In a phrase, things are doing "Not good" if you are a bull. All but one of the BPI's have recently had their 20-day MA cross under their 50-day MA and most are continuing to move lower. A strong rally will be needed very soon to prevent most of them from moving below 50 for the first time in quite a while.
- Chip


