I was certainly looking for a bounce last week, but if I'm being honest, I wasn't looking for THAT kind of bounce. Our major indices all gained over 5% in just one week. That's not a bad return for a YEAR!!!
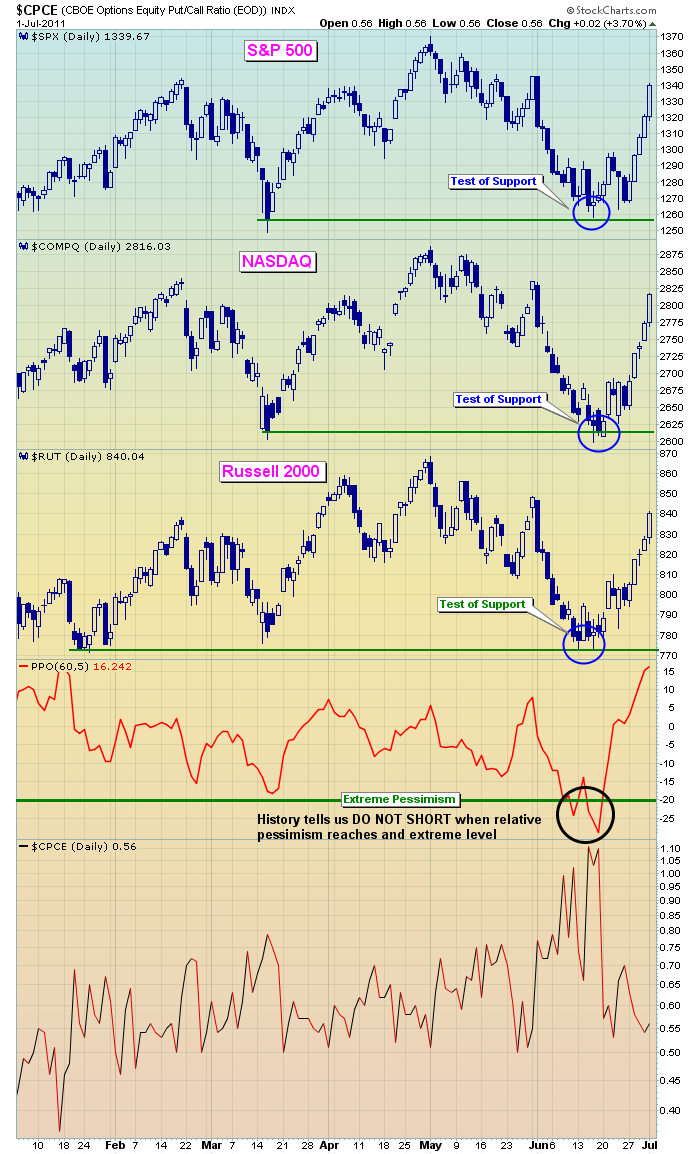
There were definitely signs of a bounce on the horizon. We approached or tested critical price support on the S&P 500, NASDAQ and Russell 2000 at a time when pessimism - as I measure it - was OFF THE CHARTS! I favored shorts in the first half of June, but it became clear to me that the risk of being on the short side simply became too great.
When the market is driven in one direction for too long, as it was in the first half of June, and relative pessimism soars, the risks of remaining short grow exponentially. Unfortunately, that's when the emotional trades begin for many traders and they jump in on the short side just as the southbound train reverses direction and heads north again. Or worse yet, they let a great short call turn sour by holding profitable short positions way too long.
Let's take a look at what the market was up against in mid-June:
The EOPCR (equity only put call ratio) is my favorite sentiment indicator. It's a gauge of the pendulum effect in the stock market when emotions run too high in either direction. I look at a short-term moving average of the EOPCR and compare it to a longer-term moving average. As the relationship swings, it identifies mood swings of traders and has a very strong track record in calling for reversals, which are absolutely critical in trading. The extreme pessimism readings we witnessed in mid-June were record-breaking, only four months after we saw record-breaking relative optimism in February. To summarize, this market is NUTS!
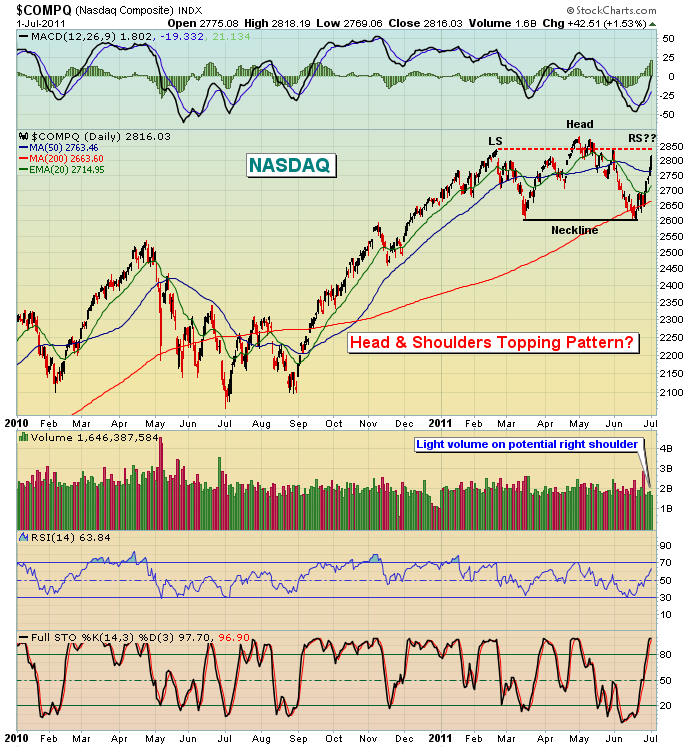
While the rally last week felt great, I'm not convinced just yet the intermediate-term selling is done. The NASDAQ, in particular, is still showing a rather bearish head & shoulders pattern in play where the recent bounce may have been a nasty right shoulder - and on lesser volume. Check this out:
There was one other indicator flashing HUGE bullish signs last week - The Bowley Trend - my own historical indicator. Prior to last week, I had mentioned to all of our subscribers that the upcoming week (June 27th through July 1st) had produced annualized returns since 1950 that were TRIPLE the average annual return of the S&P 500. The rally was RIGHT ON CUE.
If you want to take on Wall Street and WIN, you'd better be armed with all the knowledge and tricks you can muster. Otherwise, you're going to war with a water pistol. For the July 4th holiday, I'm offering a special bonus to all ChartWatchers' readers. I wrote a piece entitled "The 4 Historical Rules EVERY Trader and Investor Should Know". It's yours ABSOLUTELY FREE!! Simply CLICK HERE.
Have a great July 4th holiday weekend with family and friends and....
Happy Trading!


