Gerald Appel created the MACD in the late 1970s. It's a momentum oscillator that serves to gauge the strength and direction of a trend, but what I find most useful is its ability to predict a reversal. If you like to short weak stocks, I can't blame you. Beware, however, the long-term positive divergence on the MACD when it appears. Before I provide a couple examples of how the MACD predicts reversals, let me briefly explain how the MACD is calculated. I'm a numbers geek, so I NEVER blindly follow an indicator. I need to know how an indicator is calculated and why it works. Then I have to test it. The MACD really isn't that complicated and the charts at StockCharts do almost all of the work for you. Once you understand the basics, the technical picture becomes clearer. Like anything else, though, you will need to practice and experiment with it before committing to it.
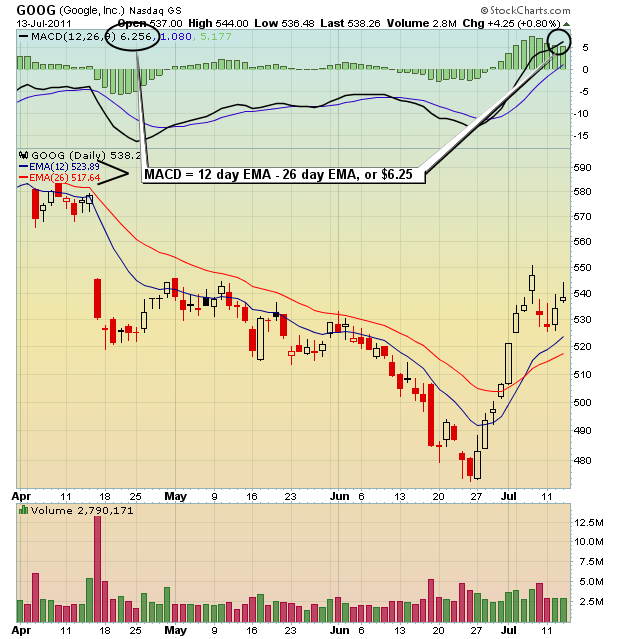
The MACD is the difference between two exponential moving averages (EMAs) using closing prices. That's it. Here's a quick example using Google's (GOOG) chart at Wednesday's close:
That's the basic definition and calculation. It's really not difficult. You're simply watching how two moving averages relate to one another over time. The beauty of the MACD, however, is watching what happens in many instances when prices continue trending in a certain direction, but the MACD moves in the opposite direction.
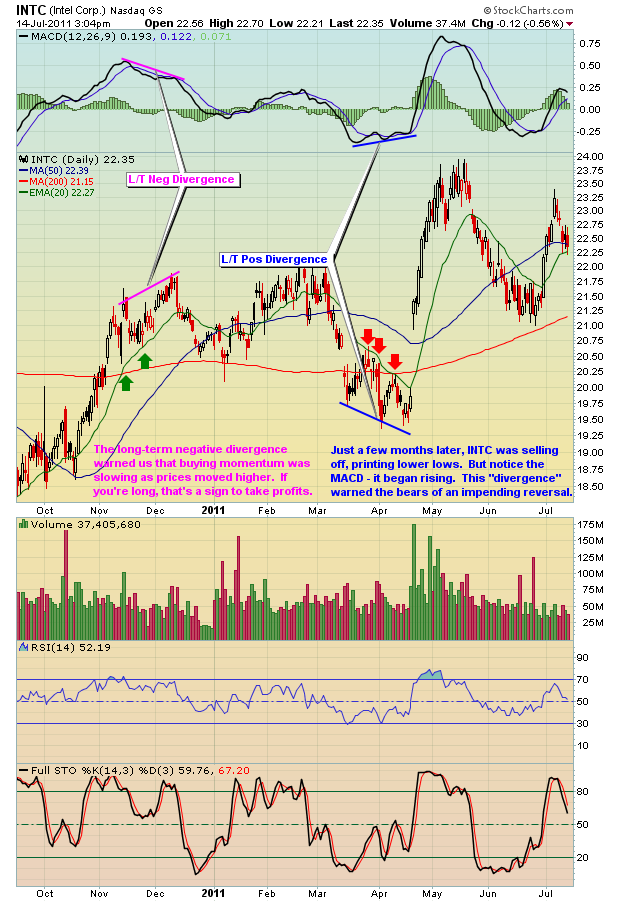
Check out two instances in the last 8-9 months where the MACD provided stern warnings on Intel (INTC):
Again, I'm not necessarily going long INTC at the first sign of a long-term positive divergence, but I'm certainly not sticking around on the short side. The MACD warns us of slowing momentum - both buying and selling - and it's worth paying attention to.
If you want to sharpen your skills with the MACD, I'll provide you two ways to do it. Invested Central offers a FREE (and highly educational) MACD Boot Camp that discusses various topics relating to the MACD. I'm also hosting our monthly Online Trader Series (OTS) event, "Implications of Long-Term Positive and Negative MACD Divergences" on Thursday, July 21, 2011 at 4:30pm EST. CLICK HERE for details.
Happy trading!


