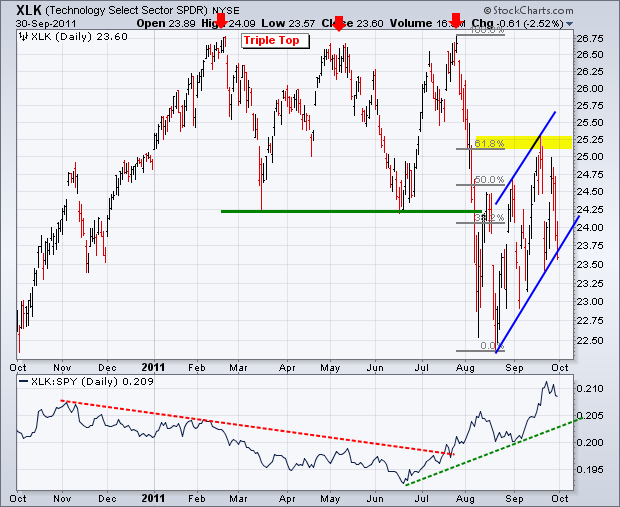
After hitting resistance at a key retracement this month, the Technology ETF (XLK) fell with what looks like a continuation of the bigger downtrend. First, notice that the ETF formed a massive Triple Top that extends from January to July. XLK became oversold with the July-August breakdown and then retraced 61.80% with the bounce back to the 25.25 area. Even though XLK moved back above broken support, a 61.80% retracement is normal for a counter trend bounce.
This advance looks like a Rising Channel on the daily chart and a Rising Flag on the weekly chart. These are also typical for counter trend advances. Regardless of the pattern interpretation, a move below the lower trendline and the late September low would signal a continuation of the July-August decline. This would target further weakness towards the 21 area. Using a Flag or Measured Move technique, the length of the prior decline (26.75 – 22.50 = 4.25) is subtracted from the September high for a target (25.25 – 4.25 = 21).

Click this image for a live chart.
The technology sector showed relative strength in September and was the market leader. The indicator window shows the Price Relative moving higher since late June. The Price Relative is the XLK:SPY ratio. This ratio rises when XLK outperforms SPY and falls when XLK underperforms SPY. Even though the Price Relative remains at high levels, a breakdown in this leading sector would be quite negative for the broader market.


