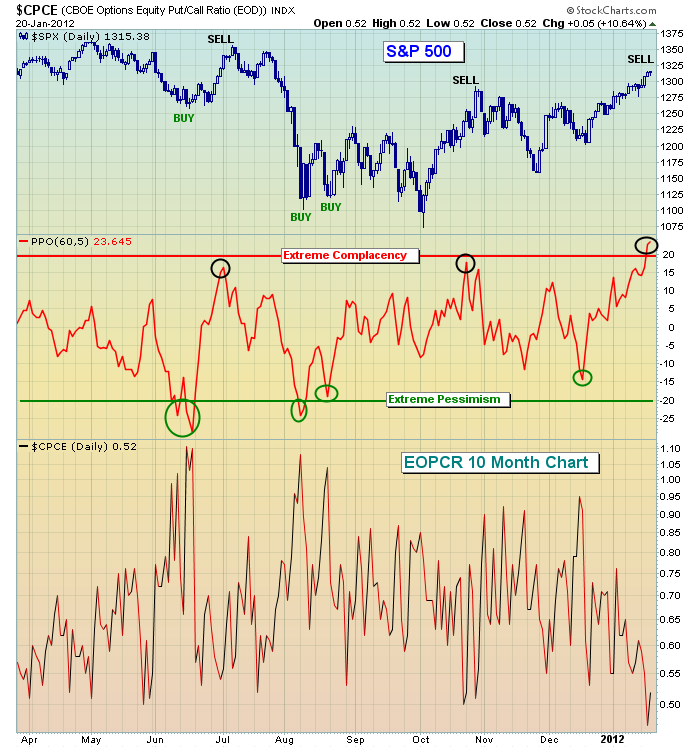
Ok, I'll admit I'm being a little dramatic. But everyone should know how I feel about my favorite sentiment indicator - Relative Complacency/Pessimism. One month ago as the market was dropping, I wrote about how relative pessimism was building and how that could limit the downside action. Well, today the reverse is true. On Thursday, we printed .48 on the equity only put call ratio (EOPCR), the lowest reading in nearly one year. I don't grow too concerned by one day's swing towards call buying, however. I get concerned when it continues to happen and the short-term pendulum swings too far in the direction of optimism, or complacency. That's where we stand now. The 5 day moving average of the EOPCR is now at .56, an historically low level. Below is a chart that uses the EOPCR to chart the relative complacency/pessimism ratio and you can follow how the S&P 500 reacts to the sentiment pendulum swinging back and forth:
While I didn't mark the December low as a "BUY" point because it never quite reached the extreme relative pessimism that I look for, the sentiment pendulum had clearly swung towards pessimism and that's a warning sign if you're on the short side. As relative pessimism grew, the RISK of being short grew and as 20/20 hindsight now shows us, shorting at that time would have been EXTREMELY painful. The lessons learned by trading on the side of the masses are expensive. Sentiment does not provide us a guarantee of market direction. Rather, it helps us to evaluate the risk of a particular trading strategy. And sentiment, by itself, does not mark long-term tops and bottoms. It is MUCH more useful to an active trader than to a long-term buy and holder.
Now go back to the chart above and take a look at where the relative complacency level currently stands. The stock market has not been this complacent in the last year. Is this marking a near-term top? From my extensive studies on the subject, relative complacency is not as a reliable in marking tops as relative pessimism is in marking bottoms. I'm not a psychologist, but I imagine that fear is bigger motivator than greed. Having said that, however, I think it's important that those on the long side simply understand that the RISK of being long is growing. There are no guarantees of a top. As I tell our members often, the only thing I can guarantee is that I'll be wrong sometimes. You can etch that one in stone. If you're looking for perfection, you'll have to look elsewhere, because I'm far from it. But what I can recognize is the "under the surface" market signals that can help us evaluate the risk of our trading strategy. If you're long or going long at this level, just understand the much higher risk levels associated with it. The market may push higher here, but it'll have to do so with someone else's money, not mine.
The secret to trading success is having the "conviction" to play what you see, but the "discipline" to admit a mistake before it gets too costly. Some traders are always looking to be right, to justify every trade by showing a profit. They won't let go of the losers and admit they're wrong. The best traders, however, know how to balance the enthusiam of the start of every trade with the key elements of risk management. You should never lose sight of the risk you're taking. This not only applies to the types of stocks or ETFs that you're trading, but also the macro environment in which you're trading.
The intermediate- to longer-term picture looks somewhat better technically than the short-term, where we're obviously overbought. There is a VERY strong correlation between how the S&P 500 performs in January vs. how it performs during the balance of the year. I'll be discussing this historical phenomenon in my next Online Traders Series event, "The January Effect" scheduled for Tuesday, January 24, 2012.
Those interested in receiving a long-term annotated (all the buy and sell signals) chart of my relative complacency/pessimism study and how the S&P 500 has reacted to those sentiment swings in the past, CLICK HERE. In addition, you'll find more details about Tuesday's event, which will likely be sold out.
Happy trading!


