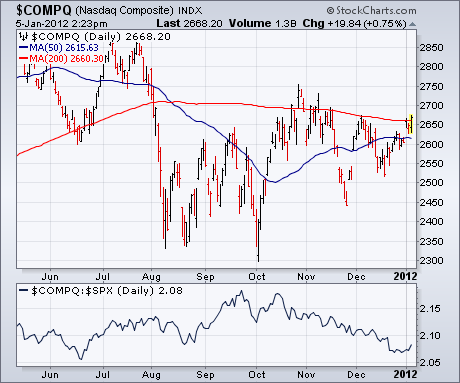
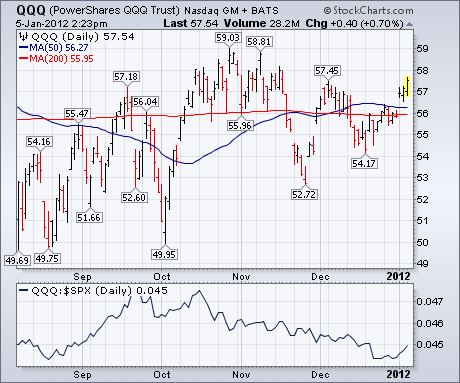
The Dow Industrials and S&P 500 indexes have already cleared overhead resistance barriers. The Nasdaq market may be next. Chart 1 shows the Nasdaq Composite Index trying to close above its 200-day moving average. That would be a positive development for it and the rest of the market. Chart 2 shows the PowerShares QQQ Trust (QQQ) challenging its early December intra-day peak at 57.45. The Nasdaq market has underperformed the rest of market since October as reflected in their falling relative strength ratios (below charts). The market usually does better when the Nasdaq is in a leadership role.

About the author:
John Murphy is the Chief Technical Analyst at StockCharts.com, a renowned author in the investment field and a former technical analyst for CNBC, and is considered the father of inter-market technical analysis. With over 40 years of market experience, he is the author of numerous popular works including “Technical Analysis of the Financial Markets” and “Trading with Intermarket Analysis”. Before joining StockCharts, John was the technical analyst for CNBC-TV for seven years on the popular show Tech Talk, and has authored three best-selling books on the subject: Technical Analysis of the Financial Markets, Trading with Intermarket Analysis and The Visual Investor.
Learn More


