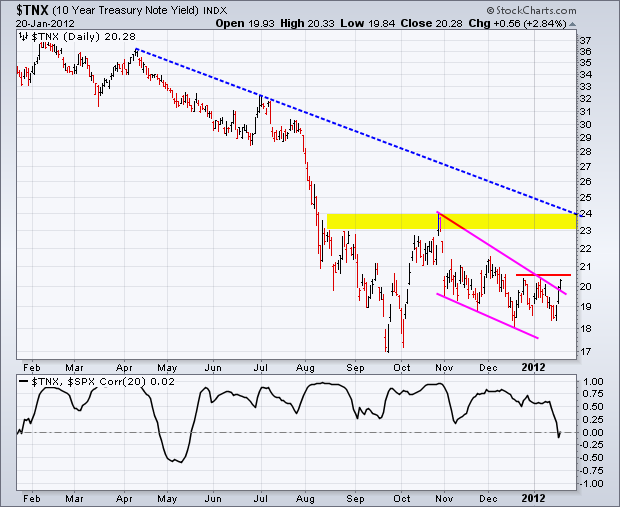
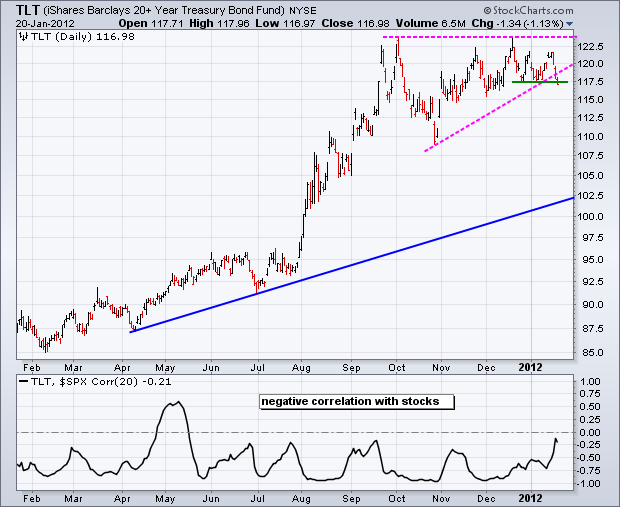
The FOMC meets next Tuesday-Wednesday and will make its policy statement Wednesday afternoon. With stocks surging and recent economic reports buoyant, the bond market may be looking ahead to this meeting with trepidation. The first chart shows the 10-year Treasury Yield ($TNX) rising sharply the last three day. Treasury bonds rise when treasury yields falls. Overall, the chart shows $TNX forming a trough at 1.7% (17) in late September and surging in October, which is when the stock market surged. Note that long-term treasury yields and the stock market were positively correlated most of the last 12 months. This means they moved in the same direction most of the time. Turning back to the price chart. The 10-year Treasury Yield ($TNX) declined with a falling wedge in November-December and held above its October low. $TNX found support just above 1.8% the last few weeks and surged back above 2% this week. Despite this surge, $TNX remains just short of a breakout. Further strength above the early January high would produce a breakout to signal a continuation of the October surge. This would target a move towards the next resistance zone around 2.3-2.4%. This would be bullish for stocks - provided the positive correlation between stocks and treasury yields continues. Note that treasury yields and treasury bonds move in opposite directions. Therefore, an upside breakout in the 10-year Treasury Yield would be bearish for the 20+ Year T-Bond ETF (TLT).
Click this image for a live chart.
Good trading,
Arthur Hill CMT


