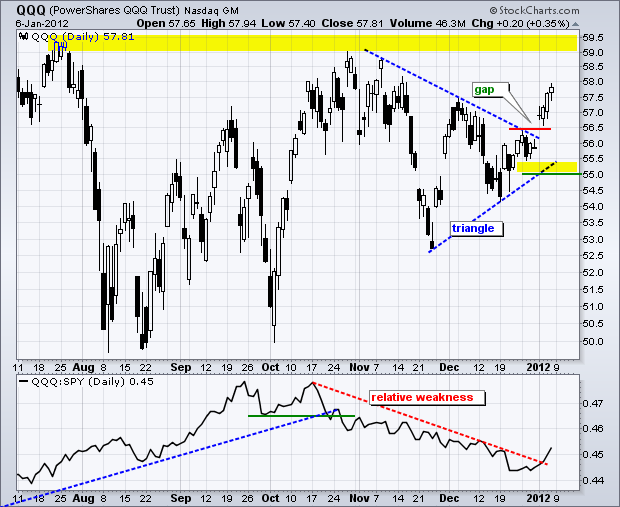
The Nasdaq 100 ETF (QQQ) is showing relative strength this year with a triangle breakout and surge above its early December high. On the daily candlestick chart below, QQQ surged in October and then consolidated in November-December. This consolidation started wide in November and then narrowed in December as a lower high and higher low formed. This year's triangle breakout signals a continuation of the October surge with the 2011 highs in the 59-59.5 area marking the next resistance zone. The gap and the lower trendline of the triangle mark support in the 55-55.5 area.
Click this image for a live chart.
The indicator window displays the price relative (QQQ:SPY ratio), which shows the performance of QQQ relative to the S&P 500 ETF (SPY). QQQ outperforms when this ratio rises and underperforms when this ratio falls. Notice how QQQ underperformed from mid October to late December. The ratio turned up at the end of December and broke the trendline extending down from the October high. This upturn shows the QQQ is outperforming SPY in 2012 - all four trading days of it!
Happy New Year and Good Trading,
Arthur Hill CMT


