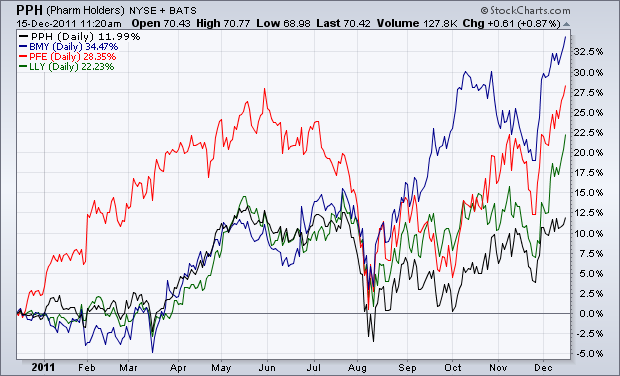
The chart below shows the three strongest drug stocks in the PPH this year. All three have recently achieved upside breakouts. They include Bristol Myers (blue line), Pfizer (red line), and Eli Lilly (green line). The black line is the PPH. As you can see, the three drug leaders have outperformed the group as a whole. That makes them the strongest stocks in the strongest industry in one of the market's strongest sectors. BMY is the strongest of the three (+34% for the year) and is trading at the highest level in ten years. Pfizer (+28% for the year) is breaking out to the highest level in four years. Lilly (+22% for the year) is trading at the highest level in three years. By comparison, the PPH is up 12% for the year (versus 8% for the XLV and -3% for the S&P 500).
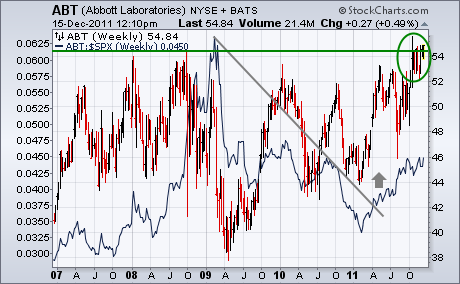
Another big drug stock that may be on the verge of a huge bullish breakout is Abbott Labs. The weekly bars in Chart 2 show that the stock has been essentially in a sideways holding pattern since 2008. That may be about to change. ABT appears poised to exceed its 2008 high around 54 which would put the stock at a new record high. The stock's relative strength (solid) line turned up during the spring and is still rising. The odds for an upside breakout are greatly increased by the fact that other drug stocks are doing the same.


