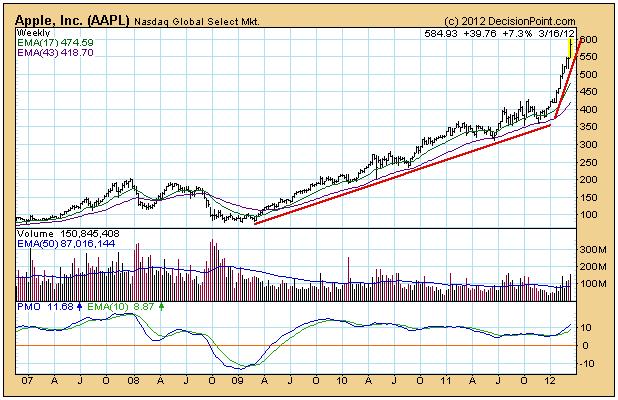
Apple is a great company, and AAPL has been a great stock since early-2009. From that point to the end of 2011 it rose +300% in an orderly, relentless advance. The angle of the rising trend line was conservative and sustainable. Unfortunately, since the beginning of this year AAPL has begun a vertical ascent, which is not strictly a paraboic, but the result of which will almost certainly be the same -- a price collapse.
Vertical price moves signal that a bubble mentality has taken over the market (the market in AAPL, not necessarily the entire stock market), and bubbles almost always end badly. When prices finally turn down, they usually drop as fast as they went up.
While we can be pretty sure of the outcome, we have no way to know at what price the final blowoff top will arrive. In a recent headline someone was predicting the AAPL would go to 850. Well, that is entirely possible, but who knows? At this point, one thing we know for sure is that where AAPL is concerned, rationality "has left the building." Use extreme caution from here out. Think housing bubble -- to the majority of investors the reasons it could never end seemed bullet proof at the time.
Is a price collapse the only possible outcome? Actually, no. Occasionally, parabolic stocks can enter what is called a "high-level consolidation," which is where price begins to move in a sideways trading range for several years. This has the effect of digesting the excesses of the previous advance. For example, if this were to happen now, the consolidation might have a range of between 400 and 600, and run for five to ten years. Emphasize, this is just an example, not a prediction.
Another area of concern is AAPL's effect on stock indexes of which it is a component -- the SPX, OEX, NDX, and XLK to name a few off the top of my head. These are all capitalization-weighted indexes, and AAPL has such a large market capitalization it has a strong influence on the performance of these indexes.
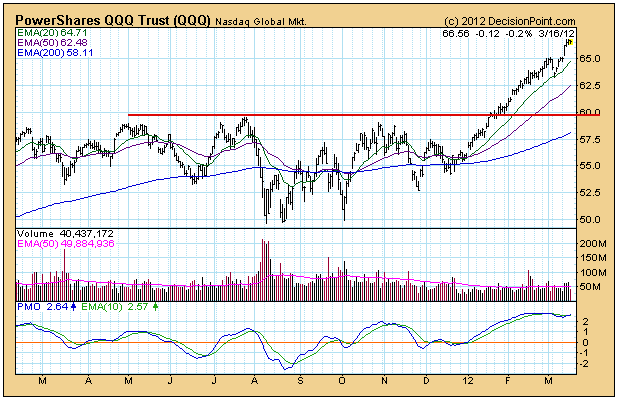
The Nasdaq 100 (NDX) provides us with a great example. The QQQ reflects the performance of the cap-weighted version of the NDX. Thanks to AAPL, the QQQ has moved about 10% above the resistance line drawn across the July 2011 top.
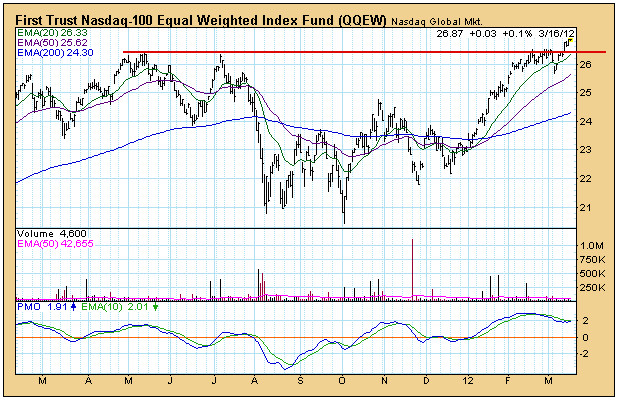
The QQEW ETF is the equal-weighted version of the NDX. Note that it has barely moved above the resistance line, because AAPL has the same weight as the other 99 stocks in the index.
Conclusion: AAPL has entered a dangerous vertical phase. We can only guess where the final top will be before a major correction or collapse begins, but extreme caution is warranted from here on. While you may not be involved with AAPL directly, be aware that radical moves by AAPL will also have an inordinate affect on cap-weighted indexes of which it is a component.

