In earlier articles, I wrote about key upcoming resistance on banks and the "January Effect". Very strong performance in January suggests that equities will continue to rally throughout 2012. If the recent performance in the banking industry is any indication, consider it confirmation.
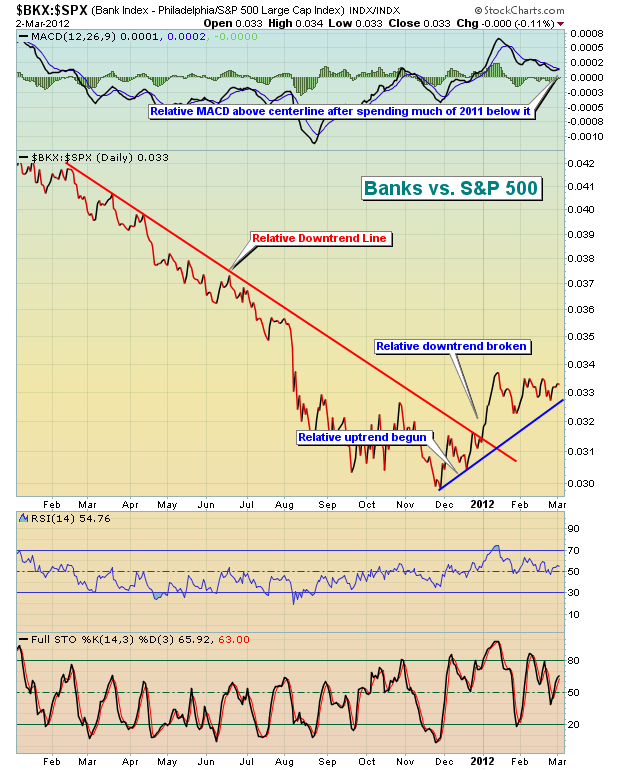
If you study history, you'll find that the stock market performs very well when banks are leaders. Since the mid-December low, the S&P 500 has risen 13.91%, while banks have led the advance, gaining 24.80%. This is a complete turnaround from 2011. The S&P 500 finished flat for the year while banks fell 24.57%.
From a fundamental perspective, I spent nearly twenty years in public accounting on the audit side. Banking was one of my areas of expertise. I can tell you from experience that bankers, by and large, are a VERY conservative bunch, despite all the shenanigans that took place in terms of leveraging in the early 2000s. When banks are not performing well, access to credit is denied in many instances where it normally would be approved. Think back to the credit crisis in 2007. Do you recall what happened to overall stock market performance? It was one of the worst bear markets in our history. GDP turned negative and millions of jobs were lost as many companies found it difficult to even borrow the necessary funds to meet payroll. That type of credit crunch and poor behavior by banks is toxic for equities.
But on the flip side, improving health at banks generally leads to easier access to credit. That, in turn, leads to economic improvement, growth and hiring. The relative performance of banks in 2012 tells me that this rally is probably closer to its beginning than to its end. In fact, I believe equities are heading MUCH higher in 2012. That differs from my forecast just 2-3 months ago, but the recent performance of banks makes it necessary to adjust my thinking.
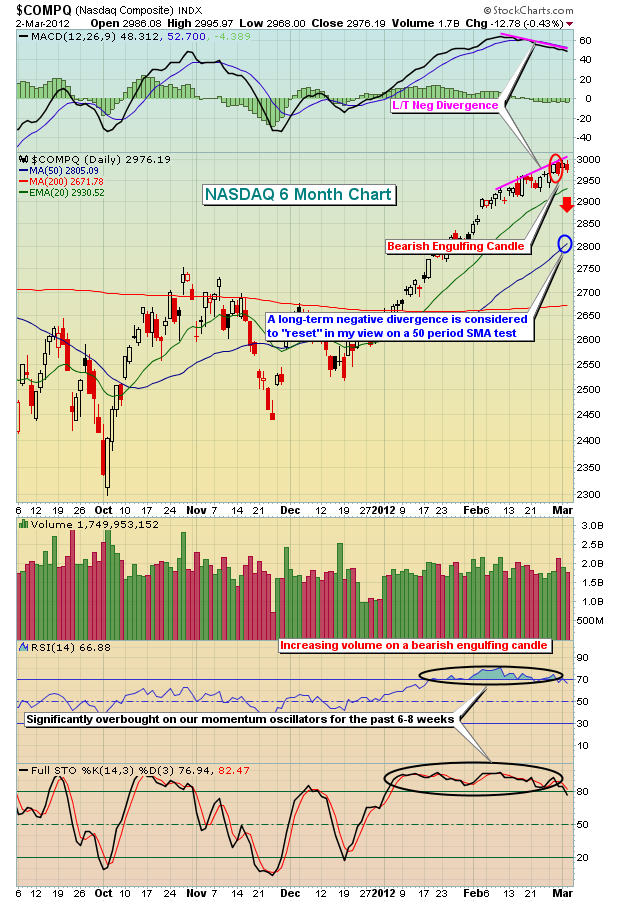
Before we take a look at banks, the market does have to deal with negative divergences on the daily charts of many indices, sectors, ETFs and individual stocks, which abound. This is a sign of slowing momentum in the near-term. It would be best technically if we were to unwind these negative divergences and "reset" the MACD closer to its centerline support. Let's take a look at the NASDAQ first as it's been one of the stronger indices in 2012.
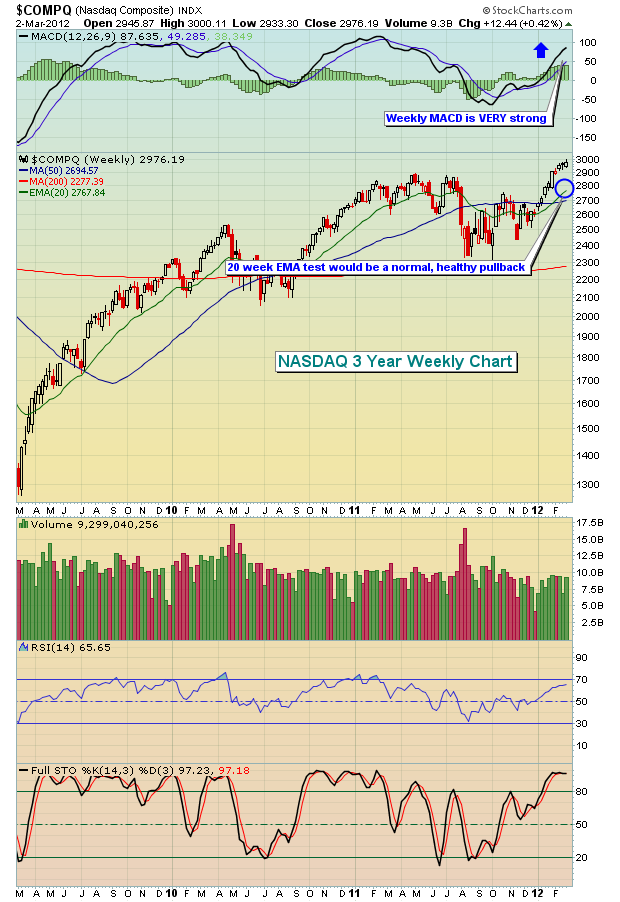
Last week, we saw a bearish engulfing (reversing) candle print on the NASDAQ on increasing volume. Personally, I grow more cautious near-term when I see slowing momentum present on the daily charts and then it's reinforced with an increasing volume, reversing candle. That's generally when I review the longer-term chart to see if the weekly divergences also show slowing momentum. Take a look at this weekly chart of the NASDAQ:
As you can see above, momentum on the longer-term weekly chart is SUPERB. Any time I see a MACD that's recently cleared its centerline and is pointing up and moving further from the centerline, that's a sign of strong and increasing momentum over the intermediate-term. Therefore, I believe the NASDAQ could benefit from a short-term consolidation period, even a bit of outright short-term selling, before another strong leg higher ensues. The interesting part is that a long-term negative divergence many times will result in a 50 period SMA test. A pullback during a period when the MACD is strong many times will result in a 20 period EMA test. On the charts above, the 50 day SMA (on the daily chart) and the 20 week EMA (on the weekly chart) are at 2805.09 and 2767.84, respectively. Both are rising, however, so a test could take place somewhat above those levels.
The negative divergence on the NASDAQ's daily chart is just one example of the problems that market bulls face in the near-term. But the long-term looks much better and much less suspicious. The performance of banks is one reason for that. The relative performance of banks vs. the S&P 500 has obviously improved. One quick look at chart below and I think you'll agree:
On Tuesday night, I'll be hosting the latest in Invested Central's Online Trader Series (OTS). This month's topic will center around the banking industry and I'll take a look at the relative performance of banks throughout the years and plot that against overall S&P 500 performance. It's one of the keys in determining whether a rally is sustainable or not and I think you'll find it both interesting and thought-provoking. For more information, CLICK HERE


