We don't look at the 4-Year Cycle chart very often, but a subscriber's comments reminded me that now would be an excellent time to view the progress of this important cycle.
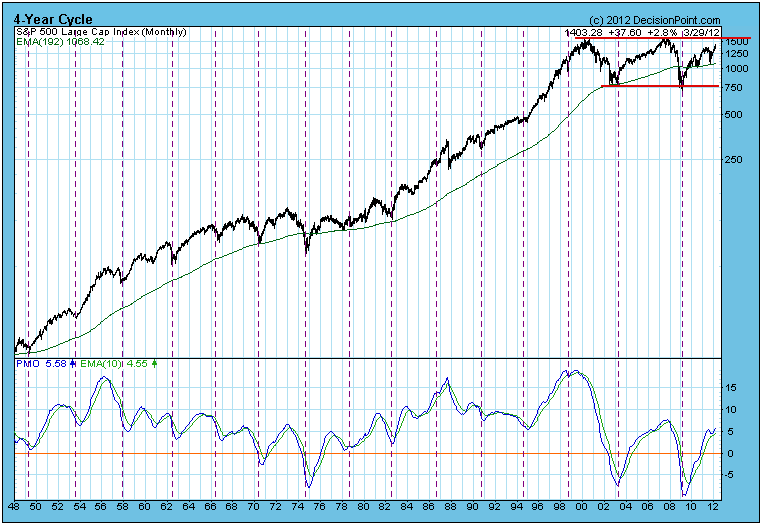
On the chart below the vertical lines show the location of all nominal 4-Year Cycle troughs since 1948. The normal expectation is that the price index will arc from trough to trough, but sometimes other forces override normal cycle pressures, and the magnitude of price lows associated with the troughs are not always as pronounced as we would expect.
To me, the most obvious feature on the chart was that the last completed 4-Year Cycle (2003-2009) was actually over six years long, which emphasizes that we can't set our watches by this (or any) cycle. As for why that cycle was so long, we can speculate that unrealistically low interest rates fueled bubbles in stocks and housing, overriding the normal ebb and flow of the underlying cycle pressures.
The most important feature is that the current cycle is about three years old, and prices are approaching a very strong level of long-term resistance just above 1500. All things being equal, it is reasonable to assume that the 4-Year Cycle (and prices) will crest later this year, probably in the area of when 6-Month seasonality switches to bearish at the end of April.
Until prices actually crest, it is difficult to project the next trough (price low), but, assuming a crest (beginning of a bear market) in the next few months, I would assume that the bear market and 4-Year Cycle low would arrive around the middle of 2013. This is not a prediction, just a template for anticipating what prices might do in the context of the 4-Year Cycle.
The subscriber also asked for clarification on the monthly PMO. Keep in mind that the monthly PMO is not final until the close on the last trading day of the month. Currently, it is rising. When it tops, it would be a very bearish signal because it confirms that the price action to which it is reacting is worse than a normal correction.
Conclusion: Assuming a "textbook" 4-Year Cycle progression, the market is probably very close to forming a major top. The Cycle is three years old, and major overhead resistance will soon be encountered.


