ChartWatchers

MIDCAPS STALL AT OLD HIGH - NYSE WEAKENS

John Murphy

John Murphy

Chief Technical Analyst, StockCharts.com

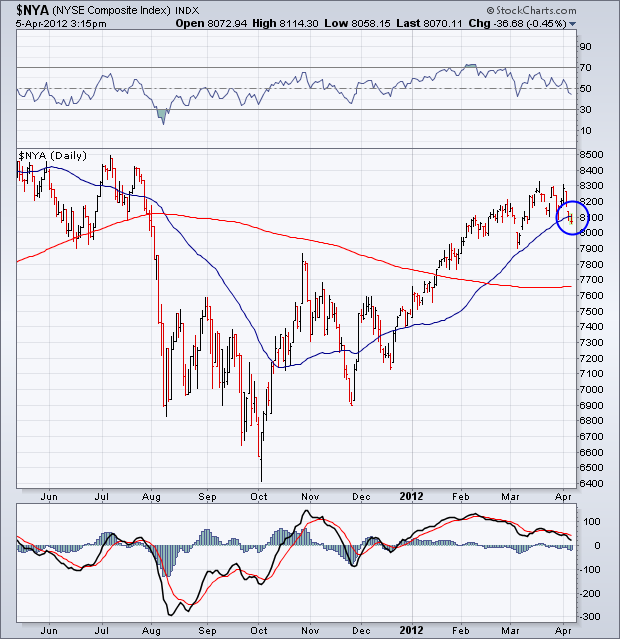
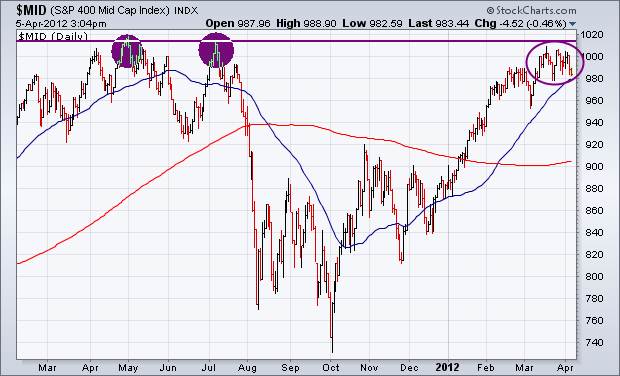
Although I generally look at the S&P 500 to get a feel for the market's trend, it's a good idea to see what other stock indexes are doing. Two of them are giving warning signals. Chart 1 shows the S&P 400 Mid Cap Index (MID) starting to meet resistance along its 2011 highs. That's a logical spot to expect some profit-taking to develop. Chart 2 shows the NYSE Composite Index which has also yet to clear its 2011 high. I suspect that's because of its heavier weight in commodity-related stocks which have been market laggards. Chart 2 shows the NYSE slipping below its 50-day average which is a sign of weakness (blue circle). Its RSI line (top of chart) and MACD lines (along bottom) have turned down. That's another warning sign.

20120405004-sc

20120405005-sc

John Murphy
About the author: is the Chief Technical Analyst at StockCharts.com, a renowned author in the investment field and a former technical analyst for CNBC, and is considered the father of inter-market technical analysis. With over 40 years of market experience, he is the author of numerous popular works including “Technical Analysis of the Financial Markets” and “Trading with Intermarket Analysis”. Before joining StockCharts, John was the technical analyst for CNBC-TV for seven years on the popular show Tech Talk, and has authored three best-selling books on the subject: Technical Analysis of the Financial Markets, Trading with Intermarket Analysis and The Visual Investor. Learn More