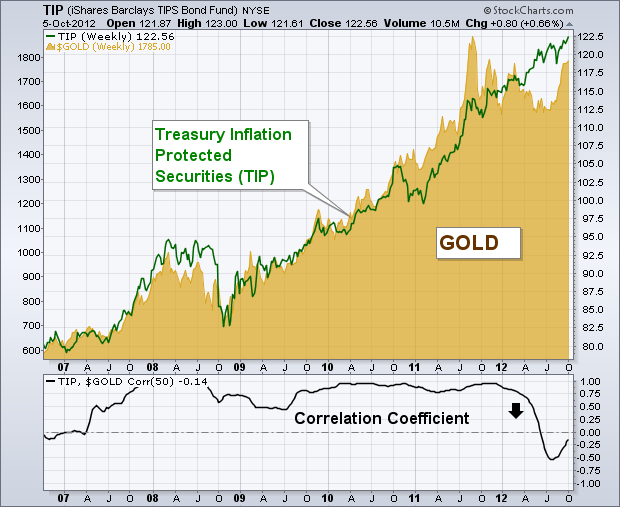
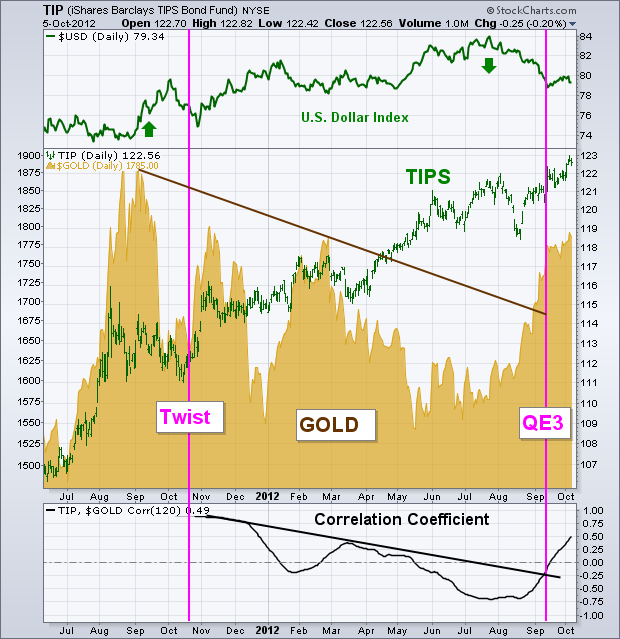
Two of the top performing assets since the September 13 launch of QE3 have been Treasury Inflation Protected Securites (TIPS) and gold. That makes sense considering that both are used as hedges against inflation. The fact is that both markets have had a strong correlation over the last decade. Chart 1 compares the performance of gold and the Barclays TIPS Bond Fund (TIP) over the last six years. That visual link between the two markets is confirmed by the Correlation Coefficient (below Chart 1) which was well into positive territory between 2007 and 2011. Their correlation weakened during 2012 (down arrow). Chart 2 shows the two markets diverging over the last year. While TIPS continued rising, gold prices fell. Gold's weakness appears to have been the result of a rising dollar (top of chart). The Correlation Coefficient (below Chart 2) turned up during September and has turned positive. Both markets are rallying together again. A lot of that has to do with QE3. The two purple lines show the launch of Operation Twist last October (first line) and QE3 on September 13 (second line). Both markets turned up during August in anticipation of QE3, and were two of the biggest gainers when it was launched. TIPS hit a record high during September, while gold broke a major down trendline. QE3 also weakened the dollar which gave a boost to gold and other commodity markets. Another effect of quantitative easing has been to push Treasury bond holders into higher-yield assets like high yield and investment grade corporate bonds and dividend-paying stocks. Meanwhile, Treasuries have become the weakest part of the fixed income group. That's due to historially low Treasury bond yields and fears of inflation further down the road. That's why investors are buying TIPS and gold.


