Hello Fellow ChartWatchers!
It's a question I get everywhere I go. After every talk I give, someone comes up and asks "What's the one market indicator I should watch to see where things are headed?" Many years ago that question gave me fits. In my brain I'd immediately have 1,000 thoughts: "There are so many indicators to choose from" and "Each indicator is interpreted differently" and "What if there are conflicting signals?" and "What if the NYSE changes its membership?" and... You get the picture. Needless to say, the answer that came out of my mouth back then wasn't pretty, or easy to understand.
Now the answer is simple: The NYSE Bullish Percent Index - period.
I've written extensively on Bullish Percent Indexes (BPIs) before. If you are not familiar with them, please click here to learn more. The NYSE BPI ($BPNYA) is the "granddaddy of them all" and is one of the broadest BPIs we publish. On numerous occasions in the past, it has been a leading indicator for the market and it always deserves periodic attention from serious ChartWatchers.
So what is it telling us now?
Click the chart for a live version.
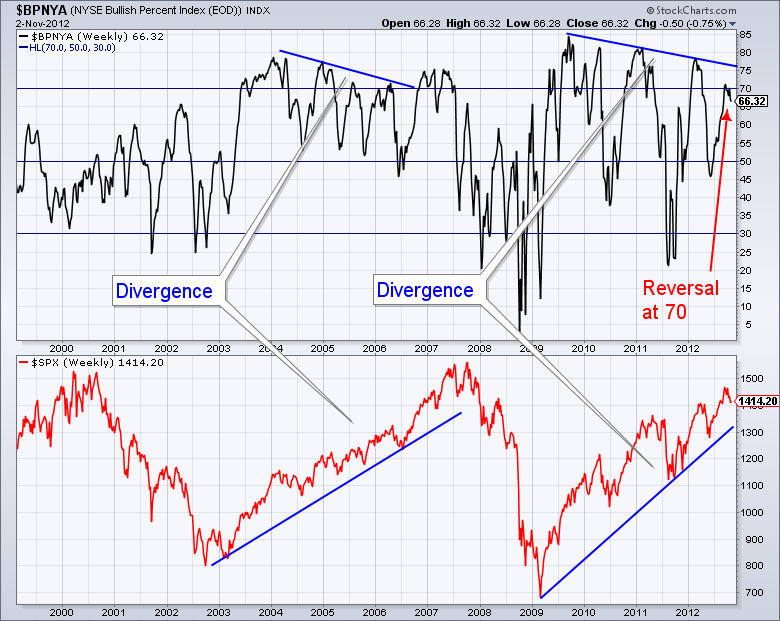
Well... the picture is not promising for a continuation of the long-term uptrend that started in 2009. The chart shows that, just like it did during the previous uptrend that went from 2002 to 2007, the NYSE BPI is breaking down and diverging from the S&P 500 index. Recently the index tried and failed to rise back above the 70% level. That failure is significant because it continues a trend of lower peaks on the chart going back to the start of 2011 and creates a clear divergence with the S&P's uptrend.
A similar situation occured in mid-2005 when the index failed to stay above 70 (and then failed again twice in 2006) .
Now that the divergence with the S&P is clearly established, any significant weakness in the NYSE BPI should be taken as a warning sign. Conservative investors may watch for a move below 40. That would have gotten them out of the previous uptrend just after the start of 2007. Aggressive investors may watch for a move below 30 which, in the previous uptrend, would have gotten them out at the end of 2007.
If the market starts to move higher again, pretty soon you will start hearing hoopla about the S&P reaching 1500, the Dow closing in on 14,000, etc. Don't be fooled. Keep your eye on the NYSE Bullish Percent. If it continues to slump, the 2009 rally will not last much longer.
- Chip Anderson
P.S. I would love to meet you at one of our upcoming SCU Seminars. During the SCU 101 seminar, I go into much more detail about Bullish Percent Indexes, Sector Rotation, and how to use all of the various tools on our website. We have upcoming seminars in Dallas, Orlando, Seattle, LA and New York. Click here for details. I hope to see you soon!


