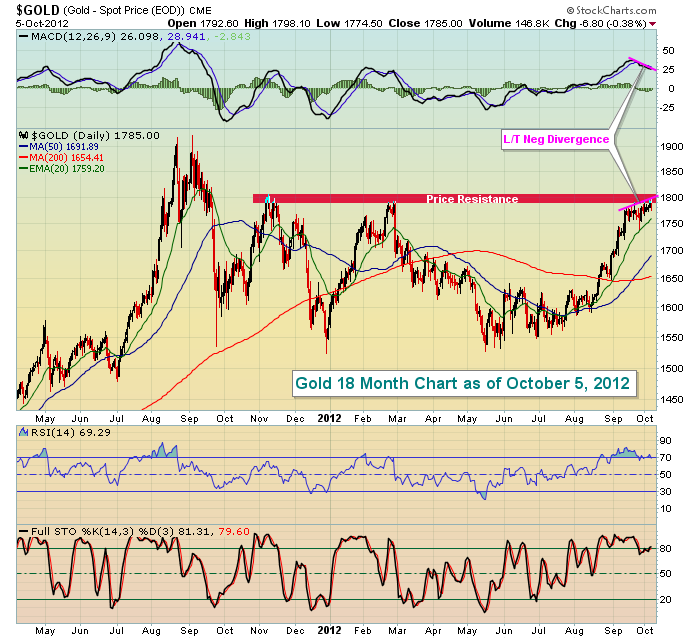
One month ago, I discussed the increased risk of holding gold as key price resistance was being tested with a long-term negative divergence on the MACD present. That was a sign of slowing momentum and that, combined with price resistance, simply tells us to grab profits and respect the resistance - at least until gold makes the breakout. Well, the breakout was never made. In fact, take a look at the following two charts.
The first chart is how gold looked one month ago:

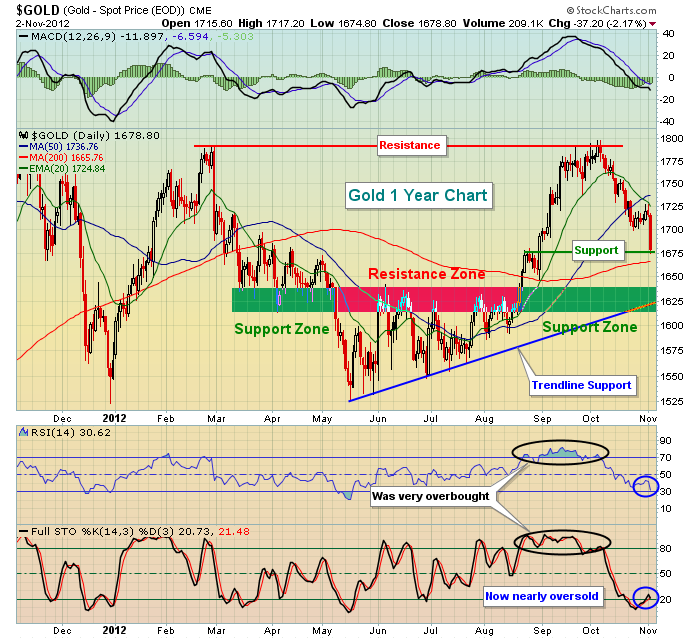
Now let's fast forward to show that resistance did, in fact, hold back the bulls and the slowing momentum and overbought conditions resulted in an approximate 7% drop that has now sent gold back much closer to key price and trendline support levels:

After flirting with $1800 per ounce, gold has fallen back to Friday's $1679 level. Note on the chart above that initial support resides at $1675. If that level doesn't hold - and it may not - more significant price support and a key trendline both coincide in the $1615-$1640 per ounce range. I'd expect that basic risk management would certainly begin to favor the bulls once again at those prices.
You can buy the metal or an ETF like the SPDR Gold Trust Shares (GLD) to attempt to profit from swings in the price of gold. Another way to potentially benefit is to buy the stock of a gold miner. One gold miner looks interesting to me and I'm including it as my Chart of the Day for Monday, November 5th, 2012. It's provided FREE and you can learn more by CLICKING HERE
Happy trading!
Thomas J. Bowley
Chief Market Strategist
Invested Central
The first chart is how gold looked one month ago:

Now let's fast forward to show that resistance did, in fact, hold back the bulls and the slowing momentum and overbought conditions resulted in an approximate 7% drop that has now sent gold back much closer to key price and trendline support levels:

After flirting with $1800 per ounce, gold has fallen back to Friday's $1679 level. Note on the chart above that initial support resides at $1675. If that level doesn't hold - and it may not - more significant price support and a key trendline both coincide in the $1615-$1640 per ounce range. I'd expect that basic risk management would certainly begin to favor the bulls once again at those prices.
You can buy the metal or an ETF like the SPDR Gold Trust Shares (GLD) to attempt to profit from swings in the price of gold. Another way to potentially benefit is to buy the stock of a gold miner. One gold miner looks interesting to me and I'm including it as my Chart of the Day for Monday, November 5th, 2012. It's provided FREE and you can learn more by CLICKING HERE
Happy trading!
Thomas J. Bowley
Chief Market Strategist
Invested Central

About the author:
Tom Bowley is the Chief Market Strategist of EarningsBeats.com, a company providing a research and educational platform for both investment professionals and individual investors. Tom writes a comprehensive Daily Market Report (DMR), providing guidance to EB.com members every day that the stock market is open. Tom has contributed technical expertise here at StockCharts.com since 2006 and has a fundamental background in public accounting as well, blending a unique skill set to approach the U.S. stock market.
Learn More


