Overall, the world couldn't be more of a sovereign wild card. But at its weakest point, sometimes the strongest investment time is at the point of most change. While I don't forecast a quick turn, what can each investor watch for to see a global improvement? I'd like to propose the following chart could really help us.
The USA just elected a president. China just elected a new leader. Europe appointed a new ECB chairman. Japan has an election coming soon with a new leader trying to push for a plunge in the Yen. That is usually bullish for the stocks there. Germany and London have traded well. Australia has as well.
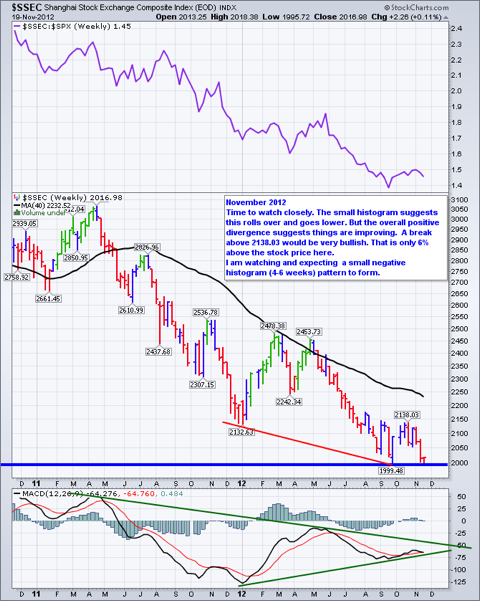
Here is why I don't want to sing a bearish tune for the long term. This chart looks excellent from a basing point. Notice the rising MACD lows while the price continues to decline. What would make a more obvious choice to start climbing than the change of leadership? It doesn't appear to be done falling yet but it is at a very interesting time.
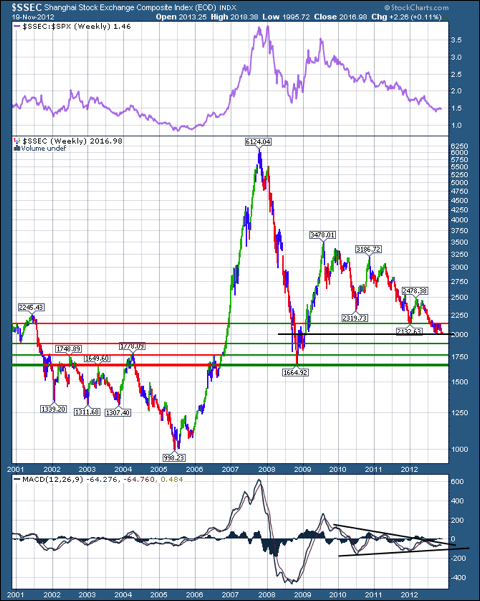
If China can make a bullish turn here that would be important. Today, the Shanghai continues to test support at 2000. The blue line at the bottom of the chart is flat at 2000. From the 2 year chart above, lets look at the 12 year chart below.
I would suggest a couple of interesting levels here. 2135 did not hold, but notice the scale levels as we go lower. Each about 5% below 2135. We currently sit near 2000. Just below this are levels at 1895, 1775 and 1665. Notice the coiling of the MACD. It is building energy here for a surge on the breakout. I didn't want to put too many lines on this chart, but an argument for a bullish wedge can be made from the 2009 high. It is called a bullish wedge because the distance between high and lows get narrower and narrower as the price falls. This creates a downward trend line on the top that has a more aggressive slope down than a trend line under the lows that has a less aggressive slope. Usually the break above the upper trend line would be fuel for a significant rise as the short positions have to cover quickly which also propels the price higher.
Have a great Thanksgiving with family and friends.
Good Trading,
Greg Schnell, CMT


