Back in November I blogged about the currencies and the events around them. Recently in Early January, 4 of the currencies in the Dollar Index were testing the trend line for the dollar cross. Today, 3 of 4 of those currencies broke down this week, and the Euro is losing strength. Keep watching as currency changes can help time market breakdowns. The Euro makes up 56% of the dollar basket, so until it breaks, this bull train continues.
First of all here is the British pound. It fell dramatically this week. $XBP It lost the 50 DMA, the trend line, and the 200 DMA all in a week. Notice the purple relative strength line plunging to new lows. The negative divergence on the RSI and the MACD played out perfectly. Remember this chart style as the $XEU is setting up a similar trade.
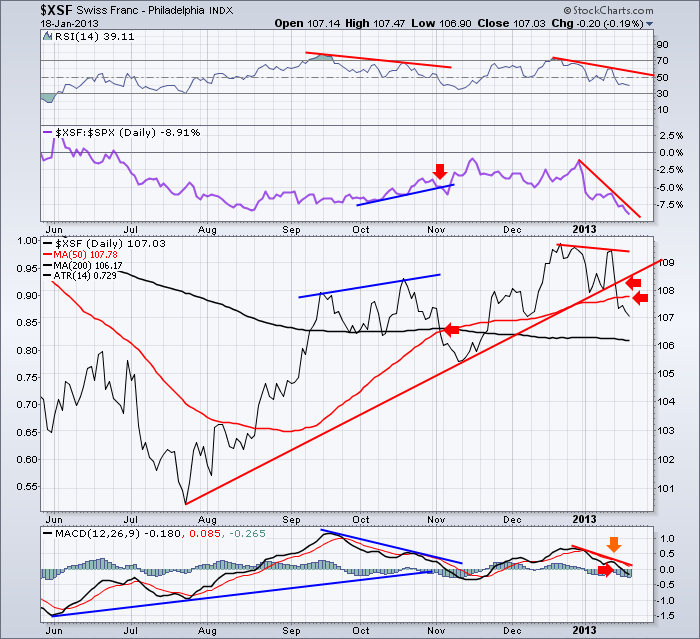
Here is the Swiss Franc. $XSF Notice the large negative divergence between September and December. Lower peaks on the RSI between the mid-September 2012 high and the December 2012 High. The price was making a higher high, but the RSI was making a lower high. The MACD was making the identical pattern. You will also notice two short term divergences between September/ October and the current move down. The price on January 14 was near the previous high, but both the RSI and the MACD were significantly lower.
This is called double divergence. We have it on the short term (2 weeks) and intermediate term (3 months).
Notice in October, the purple SPURS line was gaining strength compared to the price. So people were enjoying the outperformance of the Swiss Franc. It was breaking down through both the 200 DMA and the 50 DMA. So this is a hard signal in real time. Notice how the Swiss France bottomed a few days before the overall stock market ($SPX) bottom of November 16.
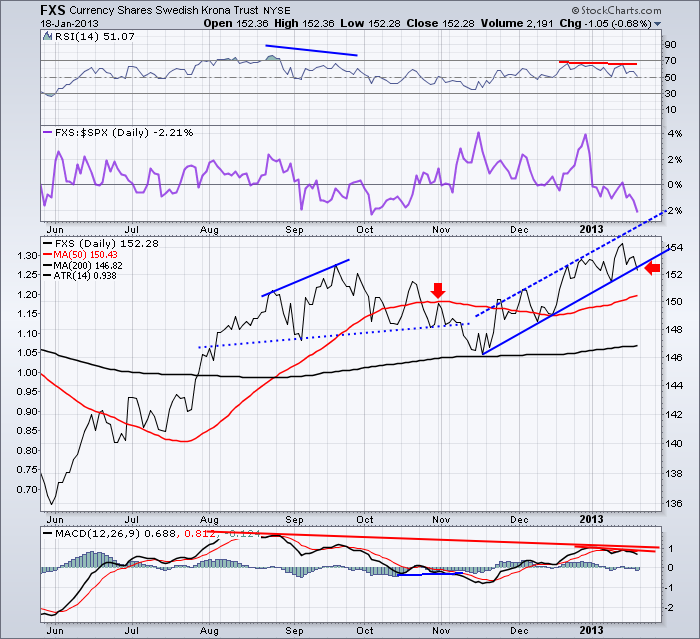
Here is the Swedish Krona. FXS You can see this chart shares many of the similarities in divergence that the Swiss Franc above shows. This market is showing even more divergence over the intermediate 3 month period. You can also see the purple relative strength breaking down. This would need to get support here immediately.
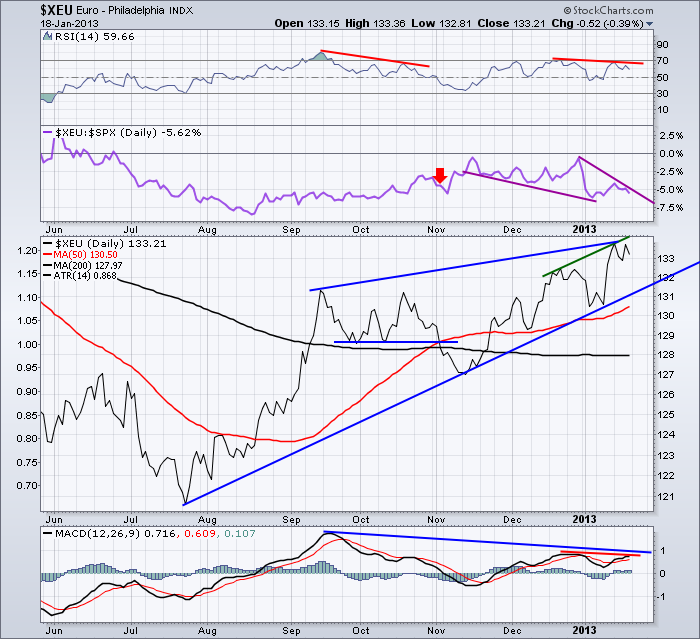
Here is the Euro. $XEU. So I won't belabour the point here. Short term and medium term divergence is apparent. The price is still clearly in an uptrend. I would suggest if the Euro starts to break lower, we'll mark a top of some sort in the equity markets.
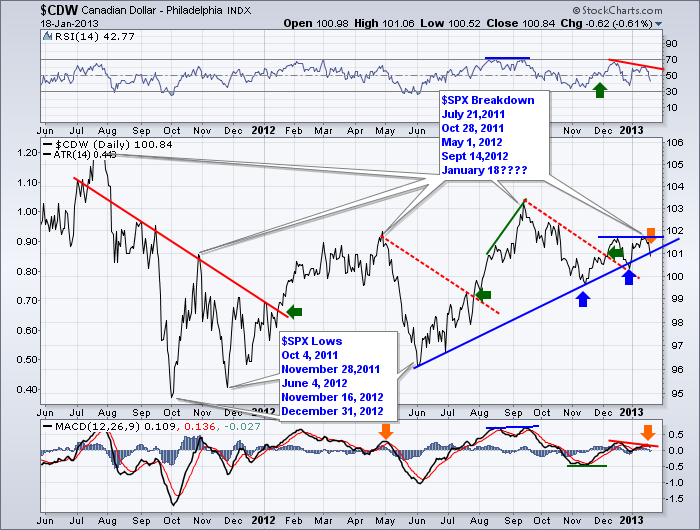
Here is the Canadian Dollar which is also usually a good indicator of the tops and bottoms in the equity market. $CDW It had a bad day Friday losing .65 cents to the $USD. On this one we see the same short term and intermediate term divergence setting up. The Loonie has dipped below the trendline once again. Will it reverse higher again? I don't expect it to with the divergence on this chart and the divergence that has created price reversals on the British Pound and the Swiss Franc.
It doesn't really matter what I expect, it is more important to follow the price action. If both the Canadian Dollar and the Swedish Krona break their trendlines, I would not be surprised to see the Euro come down as well.
The tables on the chart label the $SPX market tops and bottoms.
So, I expect the currencies to continue to help us with market direction. 2 of the smaller currencies have broken. Two more are testing the trendline and look to be breaking in terms of momentum and relative strength. The Euro appears toppy as well. The $DAX market and the $CAC have not been moving much this month. We'll see if this all concludes together.
I will be doing a webinar to the MTA on Wednesday January 23rd at Noon EST if you would like to hear my current macro view of the market and some unique perspectives on market analysis.
You can follow this link to login. MTA Webinar It is free to attend.
Good Trading,
Greg Schnell, CMT


