ChartWatchers

RECORD HIGH BY SMALL CAP STOCKS IS A POSITIVE SIGN FOR THE MARKET

John Murphy

John Murphy

Chief Technical Analyst, StockCharts.com

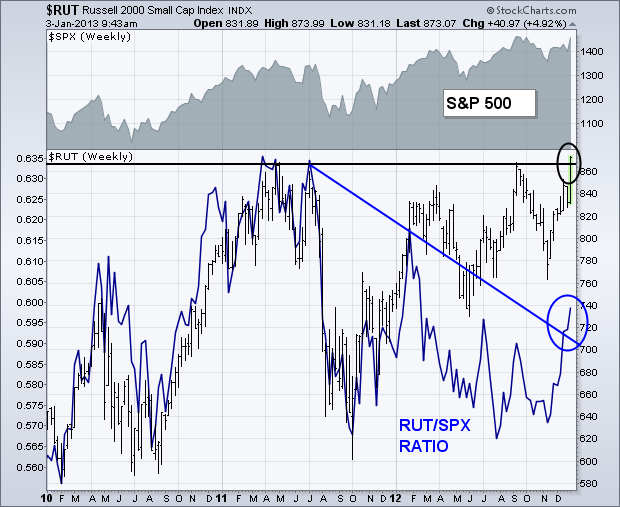
One of the most impressive technical developments of Wednesday's stock surge was the ability of the Russell 2000 Small Cap Index (RUT) to reach a record high. [The S&P 500 Midcap Index did the same]. The chart shows the RUT closing above previous highs reached during 2011 and 2012. Although not shown here, the RUT also cleared its 2007 peak. The blue line is a ratio of the RUT divided by the S&P 500. The ratio peaked in spring 2011 which began the correction/consolidation period that's existed since then. The ratio reached a new three-month high yesterday and broke its 18-month resistance line (blue circle). Given the tendency for small cap stocks to act as leaders for large caps on the upside, yesterday's bullish breakout is an encouraging sign for the rest of the market.

20130103001-sc

John Murphy
About the author: is the Chief Technical Analyst at StockCharts.com, a renowned author in the investment field and a former technical analyst for CNBC, and is considered the father of inter-market technical analysis. With over 40 years of market experience, he is the author of numerous popular works including “Technical Analysis of the Financial Markets” and “Trading with Intermarket Analysis”. Before joining StockCharts, John was the technical analyst for CNBC-TV for seven years on the popular show Tech Talk, and has authored three best-selling books on the subject: Technical Analysis of the Financial Markets, Trading with Intermarket Analysis and The Visual Investor. Learn More