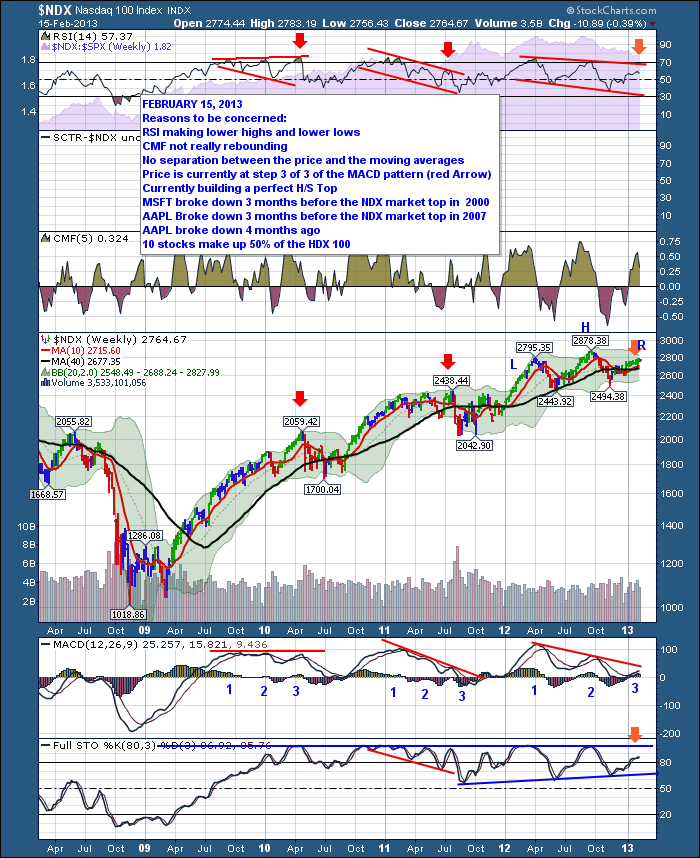
This weekend, I want to talk about the technology sector. Some of the major tops of the market have been spotted on the $NDX before the market breaks down.
Here's the chart. It has a lot of data on it. I would encourage you to click on this link $NDX to see a larger version.
Let's start at the top.
- Lower Valleys on the RSI seem to be one of the consistent themes among the recent tops.
Well, we clearly are seeing that here. 3 months after the RSI has put major lows in, we are trending up, but I think everyone could agree begrudgingly. The tech market has not exactly exploded higher. If you look at the shaded area behind the RSI, that is the $NDX compared to the $SPX. It has been under performing for a while now.
- Looking at the CMF, the surface area of the recent pullbacks below zero are large, like the 2007/2008 top.
- The major fund managers aren't as supportive.
- After 3 months off the November low it hasn't been an overwhelming bull surge in. The price action is barely above the moving averages where usually the $NDX surges away from the moving averages. Maybe its just early and I am too optimistic in this charts power to outperform.
- The Head/Shoulders pattern is remarkably clear and the MACD is mimicking a perfect trend for a head/shoulders top. Highest peak on the first one, progressively lower after that. You will also notice the red arrows I placed on the 2 previous market peaks. They both happened at the 3rd peak of the MACD pattern. Again, the lower lows on the MACD is a better indicator than the lower highs but even the slightly lower highs were present in 2010. Specifically on the MACD, we would be very concerned if the market rolled over at this level. The MACD at such a low level, rolling over near zero would confirm a bigger decline coming in my view.
- To confirm all of this, The Full Sto's are above 80 so you are in overbought territory or a strong bull market depending on your view. I don't find the full Sto's that valuable an indicator currently, but if it breaks through the bottom of the current trendline (not immediately), we could find ourselves in a big bear market. Currently, the Full Sto's are half way between. Still bullish based on any interpretation.
- Lastly, I want to point out that MSFT was the market leader and it fell fast and hard in 2000. Then AAPL was a big market leader and it fell fast and hard from Dec 2007. And then recently, AAPL was the market leader but it has recently fallen fast and hard with slight slowing of growth. After a 40% pullback, we are all expecting it to rise here. In both previous cases, the pullback was 70%.
I will blog about the tech stocks this week. You can follow my blog at this address - The Canadian Technician.
Good Trading,
Greg Schnell, CMT


