One of the hardest trades to make is the one you don't put on. Just sit. The martial arts practice Defence and Offence.
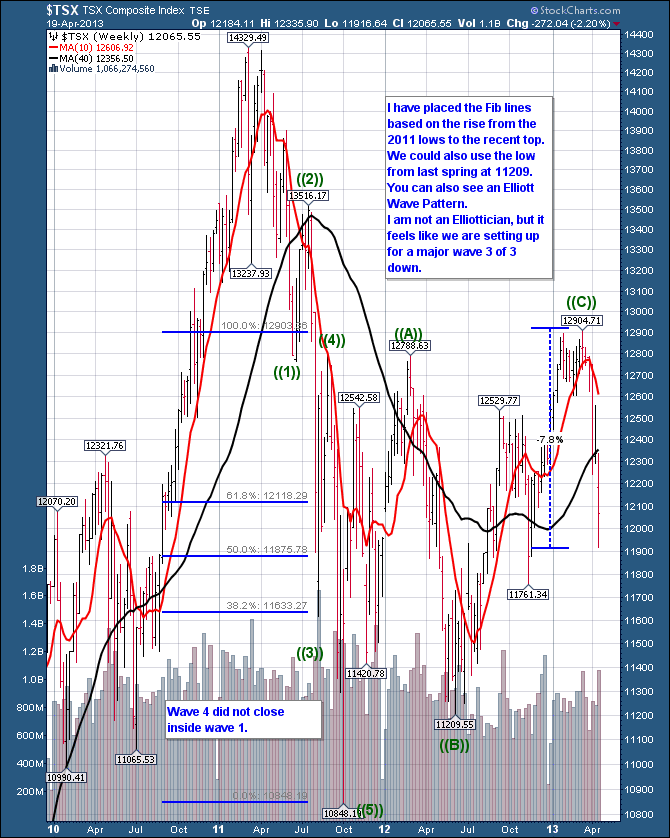
The 40 WMA (Weekly Moving Average) is roughly equivalent to the 200 DMA (Daily). Lets call it the Black belt for today. Many technicians employ a simple strategy of the price action being above or below the 40 WMA. If it is above they are bullish and below they are bearish.Depending on your investment strategy depends on how short or how long the timeline is for your long term MA.
John Murphy reviewed 2008 and remarked that the $SPX never spent 1 day above the 200 DMA all of 2008. Just sitting on your hands while it was below would have saved many accounts from the beating that ensued. So many investors could have been out of the market just using that strategy for the down turn. Here is what makes that difficult for Canadian investors. Every time the $TSX broke below the 40 WMA in the last 3 years, it surged back above, tested a higher level and then continued lower. So it's not as easy as it sounds. Here is the link to the $TSX chart. $TSX. If we use the slope of the red line it can be a guide. It is either pointed up or down while the market tests the 40 WMA. This is not infallible either but it helps. Sometimes using Elliott wave theory can try to place us on the right part of the wave structure. It looks to me like we have had a 5 wave move down off the 2011 highs, to an ABC correction which we just completed if my marks are right. An equivalent move from the 5 wave down would have us finish this corrective wave at about 9500. That would be optimistic. The bearish views of EWI (Elliott Wave International) would suggest much lower than that.Let's just say I am not an elliottician. The bottom line is the pattern looks lower right now.
Today we sit at that junction. We moved the major Canadian Index below the black belt or the 40 WMA. Now what? There are many moving parts to this chart. It feels like a thriller, and it should. The moves are straight out of 'Skyfall'. The $TSX is already 7.8% off it's highs from peak to trough. We've already had 200 and 300 point moves down in the last 3 weeks. While investing in a firestorm is very tricky, the $TSX is a market riddled with cross currents. Our major trading partner is the USA. 80% of our trade is with America. But our index is filled with commodities and has traded closer to the growth markets rather than America. So assuming the USA is doing well, tells you to stay long. Most of the growth markets are testing the 200 DMA or just the opposite of America's charts.
An example would be growth markets like Shanghai daily. ($SSEC).
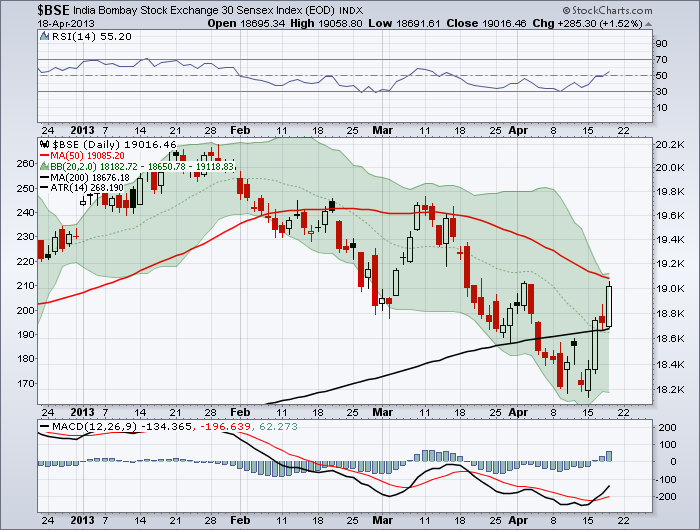
and India daily.($BSE)
Both had 2% up days this week which may be indicative of at least a slowing of the downward trend if not a reversal. India moved below and is retesting the 50 DMA from the bottom. The multiple big candles suggest this move is not done. Notice that all three charts flirted with the 200 DMA this week. The $TSX made its high 6 weeks ago, roughly timing with the first test of the 50 DMA from the underside on the other two charts in March.
What we need to see now is a surge above the 50 DMA. For Canada, that is a long way above. I think watching these global indices will tell us if the frightful move to the downside in commodities is finished and we are going to reverse right here, or if we are entering into the strongest part of the major wave down. If we are entering the strongest part of the major wave down, sitting on my hands might just be the best trade I can put on. Or trade with a black belt. Defence is as important as offence. Many are enamoured with going short. It is not a game for the buy and hold either. The overnight bounces off major lows have been 150 points higher. That is hard to hold short positions through. The charts make it look easy but short time intervals are way more profitable than trying to catch the top and the bottom of the big move down. That is what I have found anyway. We are at a tricky part of the charts. Smaller positions can also help mitigate the risk.
Good Trading,
Greg Schnell, CMT


