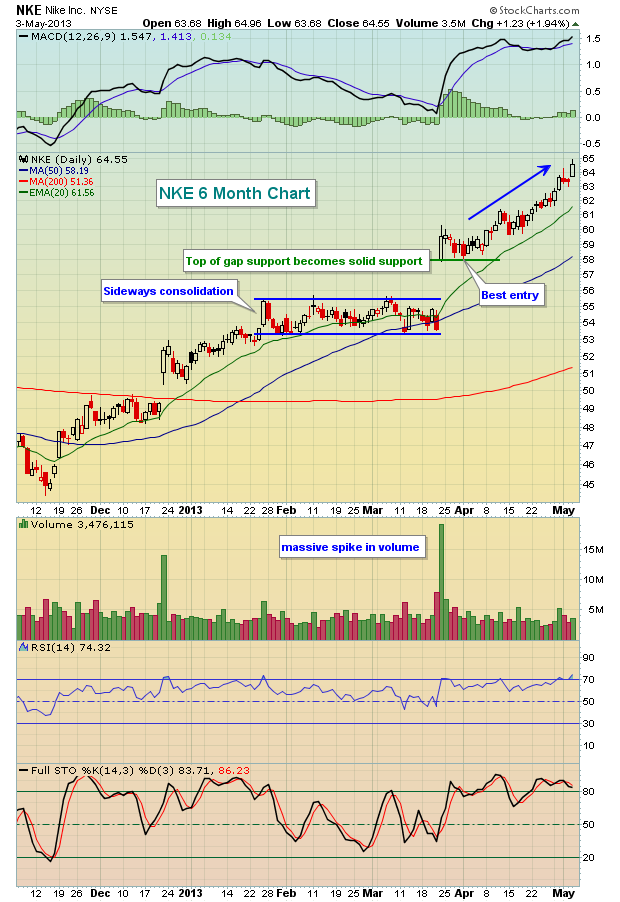
Every quarter, my goal is to identify the absolute best stocks that I can find from both a technical and fundamental standpoint. I am a firm believer that stocks beating expectations, raising guidance, trading extraordinarily high amounts of volume and printing bullish candlesticks have much better odds of trading higher than stocks that don't fit this category. For me, once the stocks are identified, it becomes a game of patience and discipline, identifying high reward to risk entry points. Great earnings do NOT necessarily mean you simply run out and buy a stock. For readers of my early April article, I provided a link to Nike, Inc. (NKE), which was my Chart of the Day for Monday, April 8th. NKE had posted strongly quarterly results, gapped higher, then pulled back to retest key gap support - an excellent entry point.
Take a look at the chart:
The gap up is where market makers opened NKE after they reported their strong earnings. Most gaps are filled and the reason is simple. When everyone is on one side of the trade, guess who's on the other side? Market makers. We know they're generally going to make their money at the expense of the retail trader. So once the initial buying takes place, stocks tend to reverse - at least temporarily - as market makers are on the short side. Gaps get filled and price support levels are reached, then market makers work off their short position and stocks are more able to move freely once again. In the case of EXTREMELY heavy buying interest, many times market makers are overwhelmed with demand and after the nice gap up, prices continue rising. From a bullish perspective, maribozu candles (opens on or near the low, closes on or near the high) with massive volume are powerful indications of accumulation after a strong earnings report. You can see what happened to NKE after it quickly fell back to test opening gap support. It's been straight up ever since, far outperforming the S&P 500.
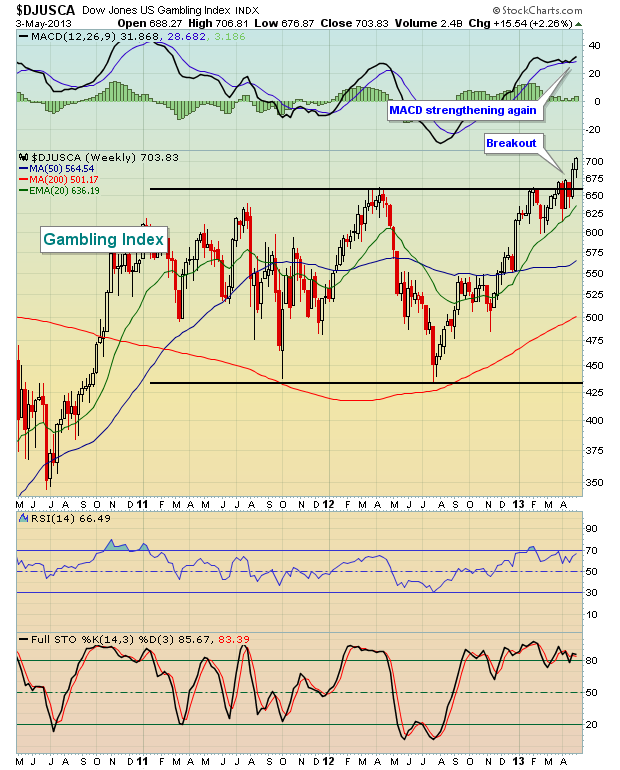
One industry group that's been seeing very strong results of late and just made a significant price breakout is the Dow Jones US Gambling Index ($DJUSCA). Take a look at the technical strength below:
One component of this index just blew out earnings estimates a little over a week ago, received a very strong technical response, but has since pulled back to a key technical support area - very similar to the technical pattern on NKE a month ago. I'm featuring this component stock as my Chart of the Day for Monday, May 6, 2013. CLICK HERE for more details.


