On a huge macro scale, we are trying to break out of a consolidation range. 13 year. Breaking out on Dow, SP500, Nasdaq, $RUT. Unfortunately, the rest of the globe has not been confirming.
But the 2 days since the Fed announcement since they removed the upside limit on intervention has really changed the shape of the market.
This was a major week for the markets.
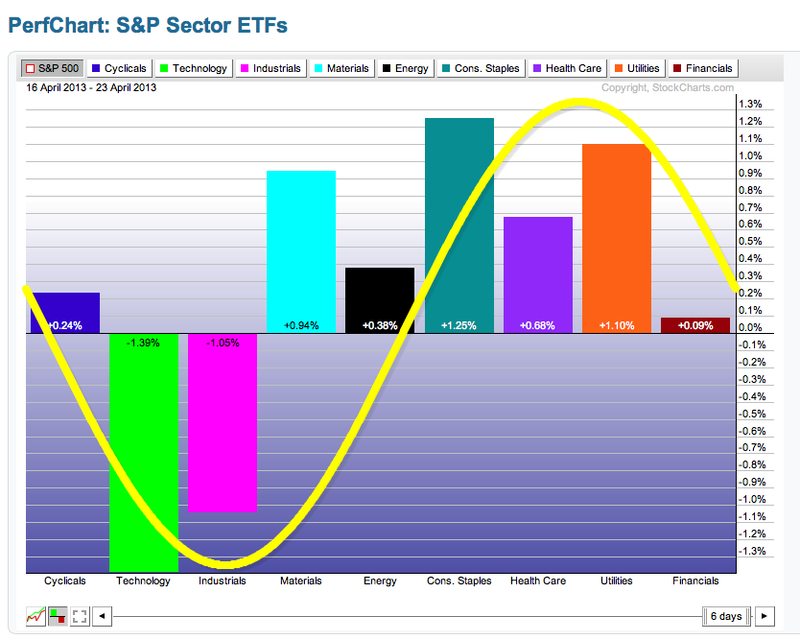
Here was a view from April 24. Notice by right clicking on the Perf Chart you can bring up the cycle tool and slide the yellow line, left to right!!!!!! (That 's a new feature!)
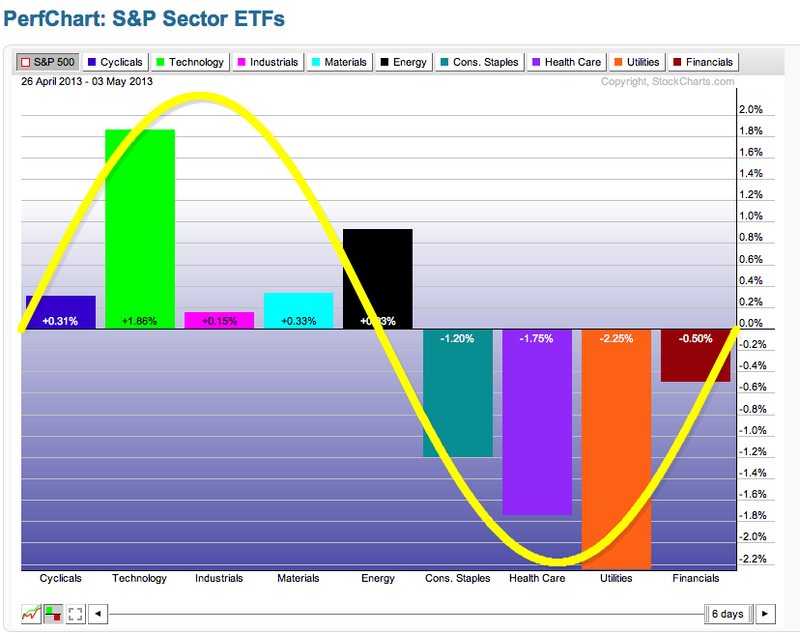
Compare that to now.
The $UTIL relative strength line plummeted. That is actually a good thing. The transition to tech leadership this week was particularly acute.
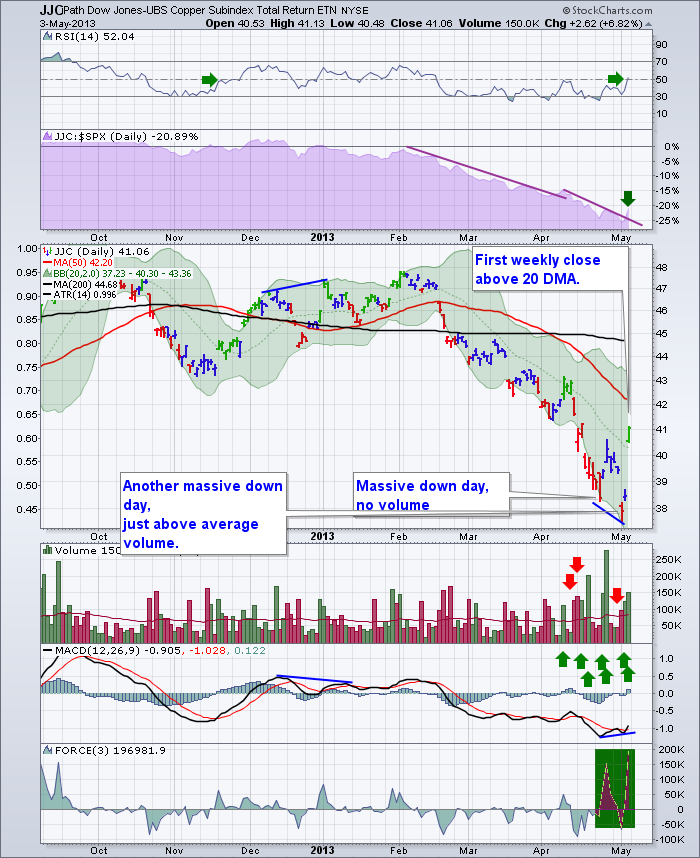
The transports were doing well, now the techs are starting to move. Next should be the industrials and raw materials. So I visited the $COPPER chart.
The 7% move in Copper yesterday was working real hard and I believe a trend change.
Unlike the $INDU market Copper kept climbing from open to close. The $INDU market opened high, climbed slightly and gave back into the close.
There are 7 big green volume candles on the daily JJC. Live Chart
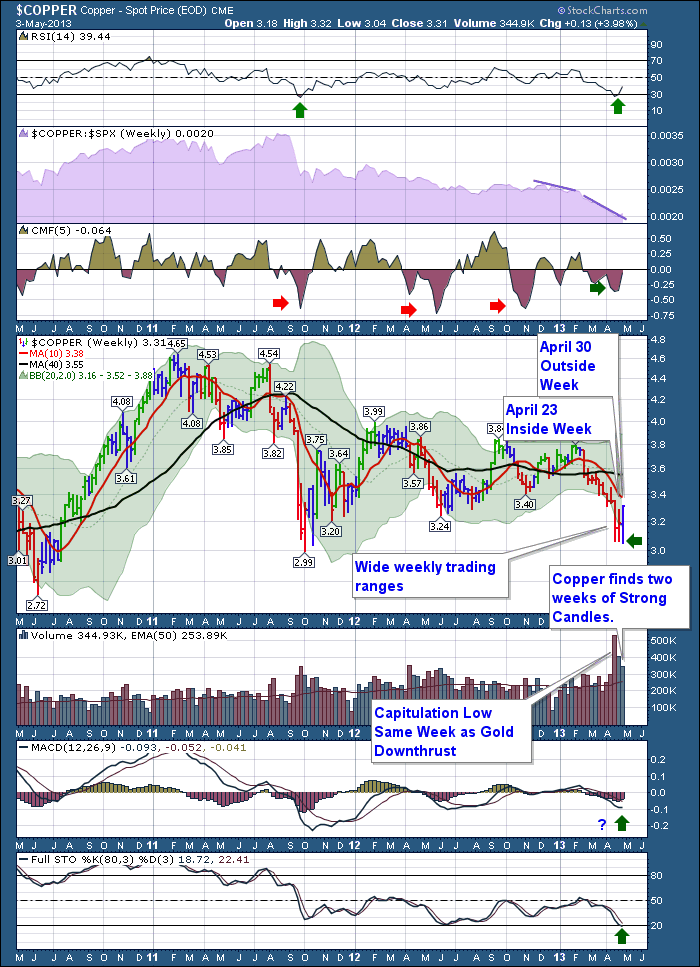
We need to look at the bigger picture in Copper. $COPPER
So one week does not make an all clear and the problems are wider spread than America, so its still cautionary. But in 7 trading days things have clearly reversed.
It's pretty important timing in the market as normally a summer swoon sets in. This week and the change of behaviour to the growth side of the cycle is very encouraging for me.
We also made a confirming move above the $SPX 1597,$TRAN, $RUT, $INDU, $TYX. We are still in a dicey spot on the charts. But when you are looking for technical signals, we got a bag of confirmations this week. Short term we might have run a bit too far, too fast. Big picture, we got some great signs this week. $COPPER's change was huge in my mind.
Good Trading,
Greg Schnell, CMT


