So much for "Go away in May"!
I've written in the past that this is VERY misleading information that's routinely provided to the investing public. For example, the month of May is one of the best months of the year to invest in small caps. The Russell 2000 has an annualized return of more than 14% during May since 1988. The NASDAQ's annualized return in May since 1971 is close to its annualized return throughout the year. Only on the S&P 500 do we see below average returns during May - and most of that weakness has generally been seen in the middle two-thirds of the month. The first and last weeks of May tend to be very bullish, even on the S&P 500. There are also very bullish parts of both June and July. The truly bearish period of the year runs from mid-July through late-September.
Financials have been leading this bull market rally on both an absolute and relative basis and that generally portends quite well for a further advance. The problem at this point is that many financial stocks are extremely stretched in the near-term and I try to avoid chasing stocks that have run too far.
Which brings me to technology.
Technology stocks have been lagging the S&P 500 on a relative basis for quite some time. I believe that technology will lead the stock market in the second half of 2013. Here are my reasons:
(1) Apple (AAPL) has bottomed in my view.
(2) Technical improvement in various areas of technology
(3) There's been a break in the relative downtrend line in technology-related stocks vs. the S&P 500.
Let's take these one at a time. First, AAPL.
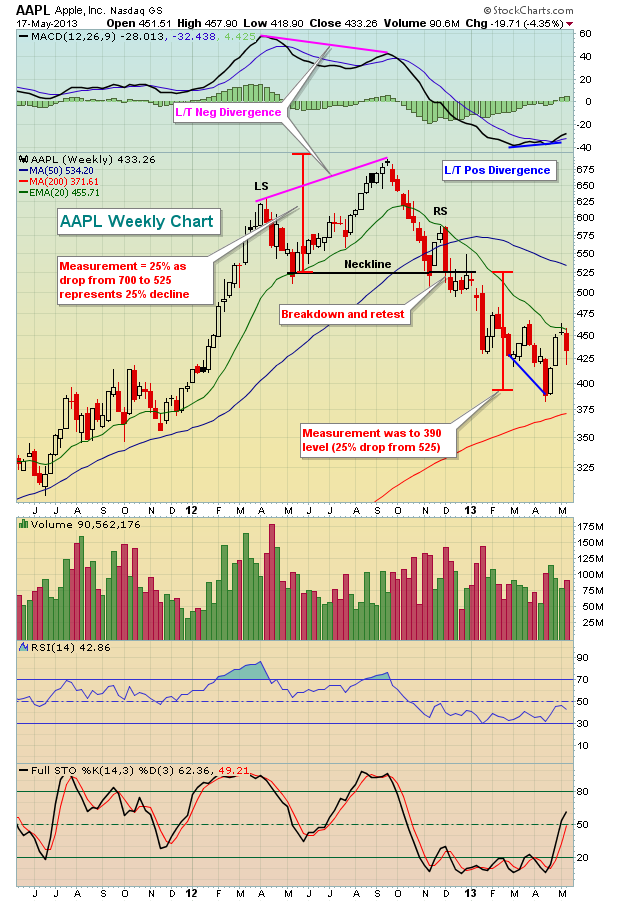
Let me explain what's happened to AAPL and then show it to you visually. AAPL made a parabolic move higher that culminated with its share price reaching 700 in September 2012. The first warning sign was the emergence of a long-term negative divergence on AAPL's weekly chart. From there, a topping head & shoulders pattern formed. It then was corroborated by a high volume breakdown that measured to 390. When it reached 390, a long-term POSITIVE divergence formed and now we're in the midst of a bottoming reverse head & shoulders pattern that will confirm on a breakout above 465.
Confused? Maybe a visual will help:

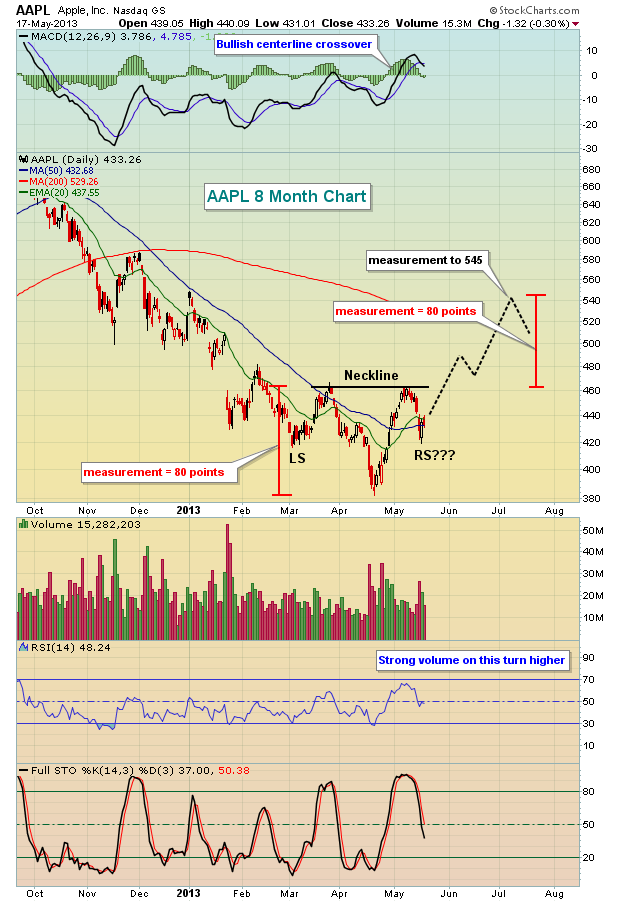
The bullish reversing head & shoulder pattern is not easy to see on a weekly chart, so take a look at this daily chart:

Keep one thing in mind here. This bullish pattern does not confirm until we see a high volume breakout above the neckline. I've drawn lines to indicate what this might look like as we move out over the next 1-2 months. But first we need to see the breakout.
Strength in technology is definitely starting to surface. I read Arthur Hill's Don't Ignore This Chart blog post from Thursday that showed how the technical rank had improved for Cisco Systems (CSCO) and Network Appliance (NTAP). If you look closer at that "improved" list, you'd also find Salesforce.com (CRM) and JDS Uniphase (JDSU) in the top 5 as well. Money is flowing towards technology and it's beginning to show on the charts.
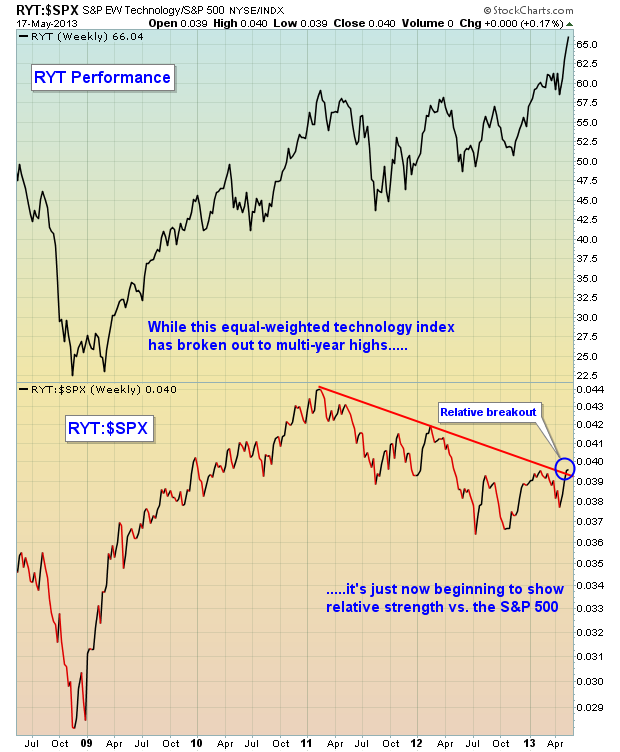
Now let's take a look at the relative strength of technology. In order to quiet the effect that AAPL has, I've chosen to use a technology equal-weighted ETF (RYT) and compare that to the S&P 500. It's just broken a downtrend line on a relative basis. Take a look:

Many technology stocks have been consolidating recently and we're just now seeing significant breakouts. One such technology stock just broke out of a cup with handle pattern and is featured as my Chart of the Day for Monday, May 20th. CLICK HERE for more details.
Happy trading!
Tom Bowley
Chief Market Strategist
Invested Central
I've written in the past that this is VERY misleading information that's routinely provided to the investing public. For example, the month of May is one of the best months of the year to invest in small caps. The Russell 2000 has an annualized return of more than 14% during May since 1988. The NASDAQ's annualized return in May since 1971 is close to its annualized return throughout the year. Only on the S&P 500 do we see below average returns during May - and most of that weakness has generally been seen in the middle two-thirds of the month. The first and last weeks of May tend to be very bullish, even on the S&P 500. There are also very bullish parts of both June and July. The truly bearish period of the year runs from mid-July through late-September.
Financials have been leading this bull market rally on both an absolute and relative basis and that generally portends quite well for a further advance. The problem at this point is that many financial stocks are extremely stretched in the near-term and I try to avoid chasing stocks that have run too far.
Which brings me to technology.
Technology stocks have been lagging the S&P 500 on a relative basis for quite some time. I believe that technology will lead the stock market in the second half of 2013. Here are my reasons:
(1) Apple (AAPL) has bottomed in my view.
(2) Technical improvement in various areas of technology
(3) There's been a break in the relative downtrend line in technology-related stocks vs. the S&P 500.
Let's take these one at a time. First, AAPL.
Let me explain what's happened to AAPL and then show it to you visually. AAPL made a parabolic move higher that culminated with its share price reaching 700 in September 2012. The first warning sign was the emergence of a long-term negative divergence on AAPL's weekly chart. From there, a topping head & shoulders pattern formed. It then was corroborated by a high volume breakdown that measured to 390. When it reached 390, a long-term POSITIVE divergence formed and now we're in the midst of a bottoming reverse head & shoulders pattern that will confirm on a breakout above 465.
Confused? Maybe a visual will help:

The bullish reversing head & shoulder pattern is not easy to see on a weekly chart, so take a look at this daily chart:

Keep one thing in mind here. This bullish pattern does not confirm until we see a high volume breakout above the neckline. I've drawn lines to indicate what this might look like as we move out over the next 1-2 months. But first we need to see the breakout.
Strength in technology is definitely starting to surface. I read Arthur Hill's Don't Ignore This Chart blog post from Thursday that showed how the technical rank had improved for Cisco Systems (CSCO) and Network Appliance (NTAP). If you look closer at that "improved" list, you'd also find Salesforce.com (CRM) and JDS Uniphase (JDSU) in the top 5 as well. Money is flowing towards technology and it's beginning to show on the charts.
Now let's take a look at the relative strength of technology. In order to quiet the effect that AAPL has, I've chosen to use a technology equal-weighted ETF (RYT) and compare that to the S&P 500. It's just broken a downtrend line on a relative basis. Take a look:

Many technology stocks have been consolidating recently and we're just now seeing significant breakouts. One such technology stock just broke out of a cup with handle pattern and is featured as my Chart of the Day for Monday, May 20th. CLICK HERE for more details.
Happy trading!
Tom Bowley
Chief Market Strategist
Invested Central

About the author:
Tom Bowley is the Chief Market Strategist of EarningsBeats.com, a company providing a research and educational platform for both investment professionals and individual investors. Tom writes a comprehensive Daily Market Report (DMR), providing guidance to EB.com members every day that the stock market is open. Tom has contributed technical expertise here at StockCharts.com since 2006 and has a fundamental background in public accounting as well, blending a unique skill set to approach the U.S. stock market.
Learn More


