Some of the most powerful,informative gauges of sentiment towards the market are the Bullish Percent Indexes.
If you are not familiar with them, you can read about them here by clicking on this link. Bullish Percent Indexes
Recently, some of the Bullish Percent Indexes reached extremes that have not been reached before.
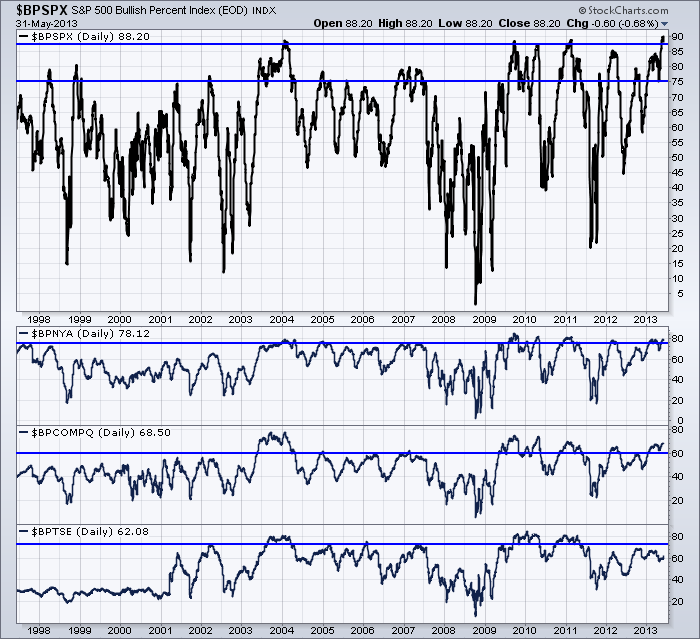
The chart below shows the Major Indexes BP readings. Click here for a link. $BPSPX
These charts are daily to see if there are any pinnacle readings, rather than weekly closes. The $SPX set a new record being above 90%.
The $SPX has never been higher. More than 450 stocks out of the 500 were on Point and Figure buy signals recently.
The NYSE composite is extremely bullish but it has been at or above this level every year for the last 5 years.
The Nasdaq Composite is surging back up to relative extreme levels above 70.
While we are all aware that commodities are out of favor, the Canadian Stock Exchange is hovering around 60%. The $TSX never enjoyed the big pushes in 2012 or 2013.
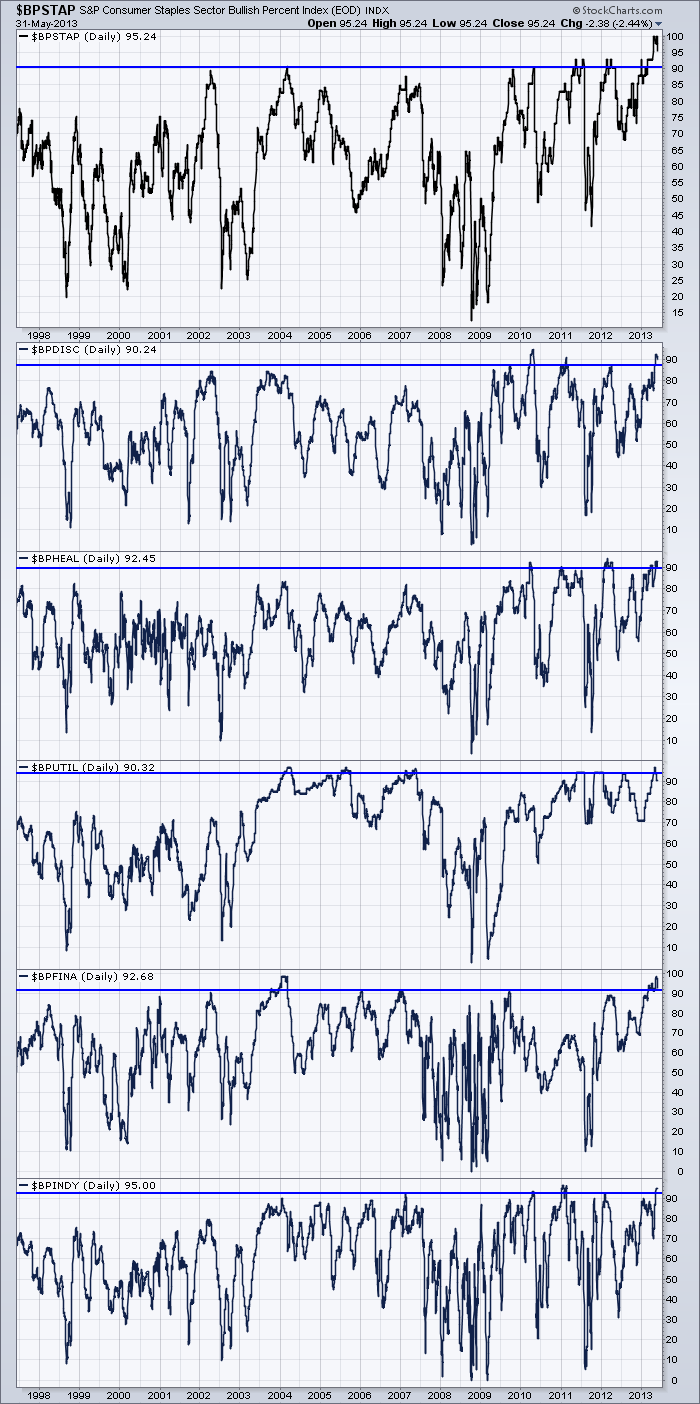
Looking at some of the individual sectors, The Consumer staples hit a record 100%. This has never been achieved before.
Consumer discretionary appears to be surging to levels not seen since 2010.
Health Care is at rare heights, but it has been up here 3 of the last 4 years.
Utilities are at levels not seen since before the financial crisis. They have recently rolled over off the highs as Staples have.
However, Financials are at 10 year highs and Industrials have only been at these levels once before.
To see the live chart, click here. $BP Sectors
So that is the definition of bullish. As long as the market holds above the 50 level, we are in a big bull market.
Each one of these daggers down or spikes up give technicians trading opportunities.
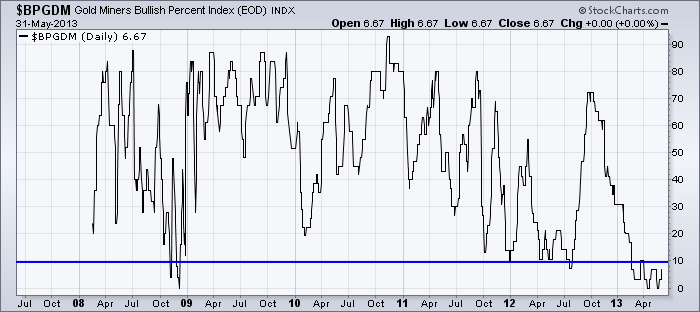
I have one more sector to show you. The gold miners index. $BPGDM.
StockCharts created a Bullish Percent Index for the miners in 2008. Notice the difference on this chart.
We are stuck in the bottom right corner of the chart.
So one of the ways to help spot a reversal in a sector is the Bullish Percent charts.
If this chart can get some upward momentum it might be time to trade some gold stocks.
Currently it is still depressed. On Friday, $GOLD was down $24 but the miners did not give up much of the gains from Thursday's push up.
A change in sentiment towards the gold mining stocks will show up on this chart. Patient technicians will be rewarded by staying tuned in.
To conclude, this bull market momentum has never been higher. If you are a contrarian, that will make you worry.
If you are a trend follower, you'll notice both the $NYA and $COMPQ bullish percent indexes got substantially weaker before the final 2000 and 2007 tops.
Good Trading,
Greg Schnell, CMT


