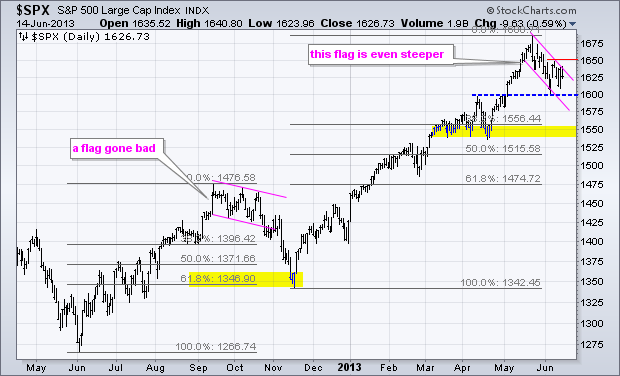
The S&P 500 got a two day bounce last week and a nice surge on Thursday, but fell back Friday as it met resistance at 1650, which is now the short-term level to beat. Overall, notice that the index formed a falling flag type correction the last four weeks. After a sharp advance from mid April to mid May, the index was overbought and ripe for a rest. The falling flag provided this rest and alleviated oversold conditions with a modest pullback. Notice how broken resistance in the 1600 area turned into support.
Click this image for a live chart
The flag is still falling and has yet to be confirmed as a bullish continuation pattern. A falling flag also took shape in September-October 2012. Instead of breaking out for a continuation higher, the index broke the lower trend line and plunged in November. This decline retraced 61.80% of the prior advance before finding support and reversing. The bears have a short-term edge as long as this flag falls, which means further weakness is possible. The March-April lows and 38.2% retracement mark next support in the 1540-1550 area. An upside breakout at 1650 would take this downside target off the radar and project a move to new highs.
Good golf and good trading!
--Arthur Hill CMT


