Customizing CandleGlance Charts
Hello Fellow ChartWatchers!
The big news at the moment is the big move in bonds ($TNX is at highest point since mid-2011) and gold ($GOLD is at lowest point since mid-2010). Several of the other commentators will have more to say about those developments below. As for me, I've got another big improvement to announce for people that like to look at lots of charts.
Customizable CandleGlance Charts Now Available!
We've just released a new feature that allows members to customize their CandleGlance charts. This is similar to the Customizable GalleryView feature that we announced in June and, depending on how you use your account, could have an even bigger impact on your use of StockCharts.com.
CandleGlance charts are deliberately designed to be small charts that let you quickly evaluate (and optionally delete) large numbers of saved charts. We have several collections of pre-created CandleGlance charts in our "Free Charts" area and members can view any of their saved ChartLists in "CandleGlance View" as well.
In my SCU Seminars, I show how critical CandleGlance view is for validating and further refining scan results as well. All-in-all CandleGlance is a wonderful tool that I use several times every day. (If you are not familiar with it, check out some of these articles for more details.)
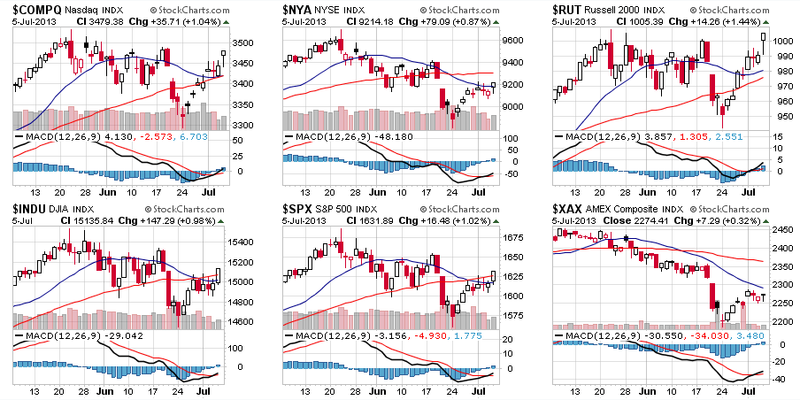
Until now however, CandleGlance charts have been limited in what they can display. There was a limited number of duration choices. The overlays were fixed to just 2 moving averages. Furthermore, each chart was limited to a single, optional indicator. Here's an example of what that looks like:

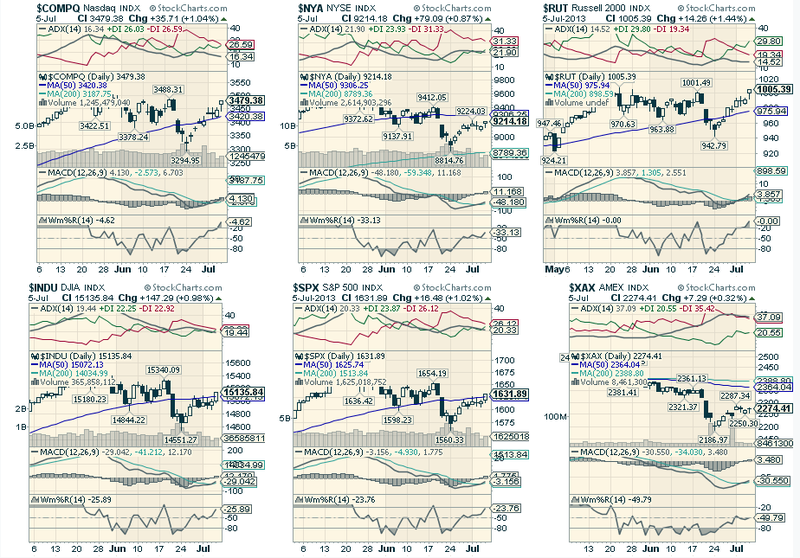
Over the years we've had many people ask us if they could change the format of the CandleGlance charts to better fit their investing style. As of today, I am happy to be able to say "Yes, you can do that!" Check out this version:

The key is to create and save a ChartStyle named "CandleGlance" (all one word, no spaces). That style will then be available to use in CandleGlance view by selecting the "My CandleGlance Style" choice in the "Duration" dropdown on the CandleGlance page.
Notes:
- This is still CandleGlance, meaning that the sizes of the charts are still small and the height of indicator panels are adjusted accordingly.
- The original CandleGlance styles are still available. Just select a "regular" duration from that same dropdown to switch back.
- If you need help creating a ChartStyle, be sure to review the "Getting Started with StockCharts" video (recently updated by Arthur Hill!)
Again, if you are a fan of CandleGlance (especially for using it in conjunction with scans), this could be a HUGE game-changer for how you use our website. Enjoy!
- Chip
P.S. Several people had trouble with the instructions for customizing GalleryView in the last newsletter. Be sure to use style names that are all one word - no spaces. i.e., "GalleryIntraday", "GalleryDaily" and "GalleryWeekly"
P.P.S. Hey Toronto! We've just gotten approval to give out IIROC/CECAP credits for our SCU Seminars that we are holding in Toronto on July 26th and 27th. That's in addition to the 3 free months of service and free DVD seminar that are included with every registration. Interested? Click here for more details.


