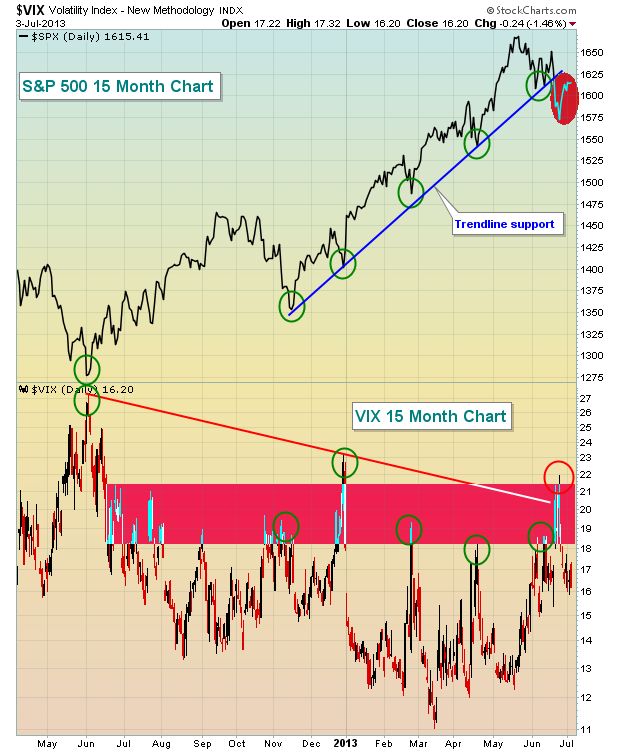
In the very near-term, it's difficult to predict which way the S&P 500 is heading. Recently, we saw the Volatility Index ($VIX) spike to nearly 22 and the multi-month uptrend line on the S&P 500 was violated. Take a quick look:
The biggest technical issue wasn't necessarily the VIX rising to 22 as we saw it move above that level in late December 2012. Instead, breaking that 5-6 month trendline that already had four successful tests was the bigger story. In my view, it changed the "cloudy" outlook for equities from a short-term concern to a more intermediate-term issue. It also happened just as we approach the worst 2-3 consecutive months of the year historically.
Here are the historical numbers - you decide if they'll impact trading in the next few months:
S&P 500 annualized return since 1950:
July 1st through July 17th: +21.48%
July 17th through September 28th: -2.04%
Since 1950, that July 17-September 28 period has covered 3140 trading days, or roughly 12.4 years worth of data. That's a lot of data and certainly should be considered a "representative sample" by statisticians. And it trails the AVERAGE annual return of the S&P 500 by more than 10 percentage points. Based on these FACTS, there is no doubt that the market has an historical "tendency" (not a guarantee) to struggle throughout this period, some years much worse than others.
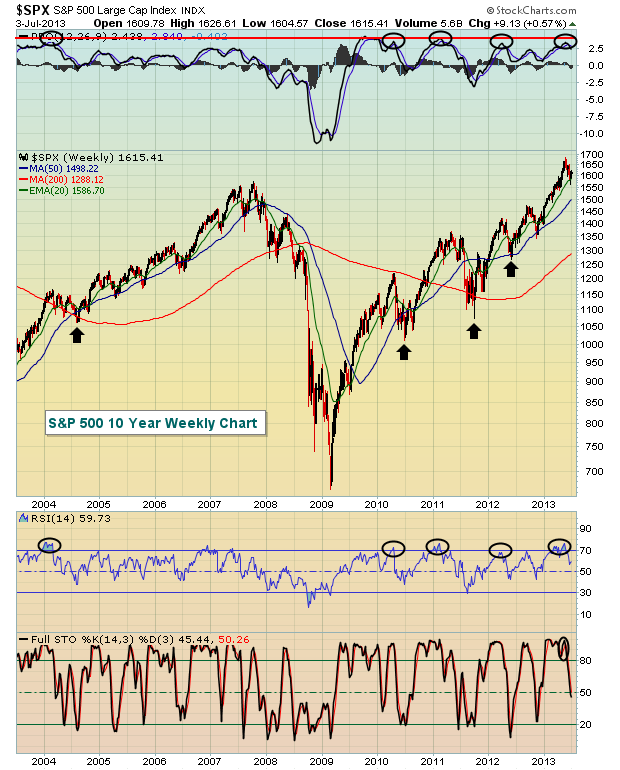
Why else should we be concerned? Well, let's take a look at the weekly chart of the S&P 500:
Check out the black circles on the chart above. It shows that over the past decade, we've seen a handful of times where the weekly PPO (percentage price oscillator - similar to the MACD, but expressed in percentages rather than dollars) is stretched to the 3-4 level and the weekly RSI hits 70 (overbought) simultaneously. In every case, we've seen selling take us AT LEAST to rising 50 week SMAs over the next 2-3 months. To be honest, it makes perfect sense. A stretched PPO tells us that the market has been running HOT for an extended period of time and the overbought RSI confirms it. A pullback really is to be expected.
But before you go running for the hills, you should also realize that key sectors/industries are performing exceptionally well on a relative basis, suggesting the longer-term bull market remains intact.
So what does all this mean? Well, it tells me that short- to intermediate-term risks are rising if you're on the long side. I combat that by trading less often and fewer shares. You can further reduce risk by selling calls or buying put insurance on the S&P 500.
Please don't misunderstand my overall view, however. I remain BULLISH over the longer-term (6-9 months) but realize the market is likely to continue its recent choppy pattern, perhaps turning more bearish later this summer. I believe we'll see 1530 on the S&P 500 at some point over the summer, possibly even the 1465-1485 area. I do not plan to short, however, as these levels are not guarantees and as I said before, I remain bullish in the longer-term.
My Chart of the Day for Monday highlights a few of the reasons for my bullishness later in 2013. You can CLICK HERE for details.
Happy trading!
Tom Bowley
Chief Market Strategist
Invested Central


