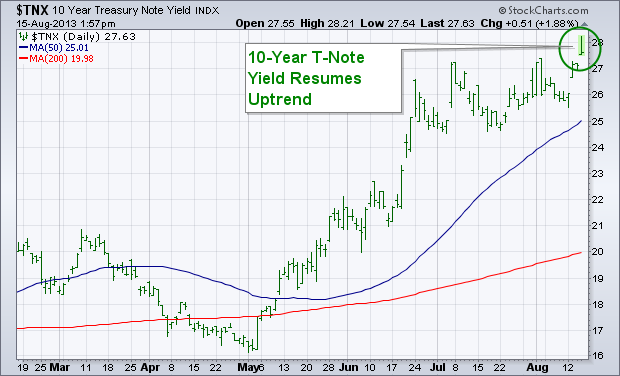
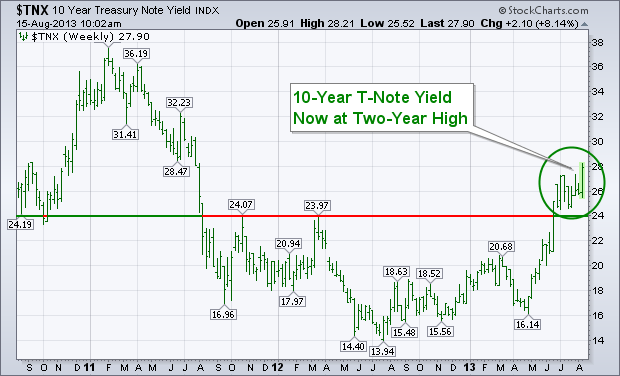
The uptrend that started in bond yields during May is resuming. Chart 1 shows the 10-Year Treasury Note Yield ($TNX) hitting a new recovery high today. That resumes the uptrend in bond yields. The weekly bars in Chart 2 show that the TNX is now trading at the highest level in two years. That confirms the upside breakout in the TNX that occurred during June when it exceeded its early 2012 high (see circle). The monthly bars in Chart 3 show the TNX also testing a falling resistance line extending back to its 2007 peak. A decisive close above that falling trendline would leave little doubt (if any still exists) that bond yields have bottomed and that the thirty-year bull market in bond prices has ended. That's bad news for bond prices that fall when yields rise. To the extent that rising bond yields are discounting an improving economy, that should be good for stocks over the long term. Over the short run, however, the jump in bond yields (and more talk of Fed tapering) is causing profit-taking in an overextended stock market.


