ChartWatchers

Bond Yield Reaches New Two-Year High

John Murphy

John Murphy

Chief Technical Analyst, StockCharts.com

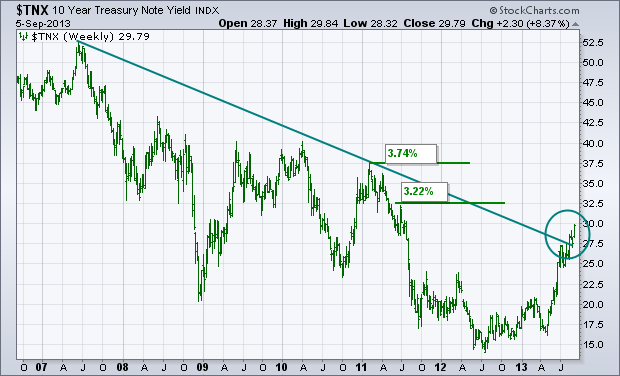
The weekly bars in Chart 1 show the 10-Year Treasury Note Yield ($TNX) reaching a new two-year high today and very close to breaching the psychologally important 3% barrier for the first time since early 2011. The TNX has also cleared a five-year resistance line extending back to 2007 (see circle). That leaves little doubt that bond yields are headed higher, and bond prices lower. Chartwise, the next potential upside targets are 3.22% (which is a minor peak formed during summer 2011) and 3.74% (which is a more prominent peak formed in early 2011). I've expressed the view that rising bond yields are a positive sign because it suggests more economic optimism. One way to measure that more bullish sentiment is to compare the recent performance of ecomically-sensitive stocks to more defensive consumer stocks.

20130905002-sc

John Murphy
About the author: is the Chief Technical Analyst at StockCharts.com, a renowned author in the investment field and a former technical analyst for CNBC, and is considered the father of inter-market technical analysis. With over 40 years of market experience, he is the author of numerous popular works including “Technical Analysis of the Financial Markets” and “Trading with Intermarket Analysis”. Before joining StockCharts, John was the technical analyst for CNBC-TV for seven years on the popular show Tech Talk, and has authored three best-selling books on the subject: Technical Analysis of the Financial Markets, Trading with Intermarket Analysis and The Visual Investor. Learn More