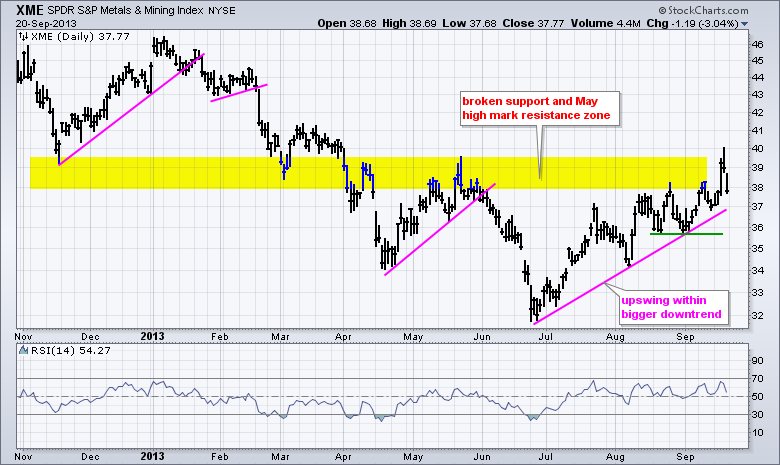
After bottoming in late June and advancing some 15%, the Metals & Mining SPDR (XME) hit resistance in the 39 area with a pop-and-drop this week. The chart below shows XME surging above 39 on the FOMC statement day and then giving most of it back with a decline below 38 on Thursday-Friday. Despite this pop-and-drop, the ETF remains in an uptrend since late June. The trend line and last week's low mark first support just below 37, while the August lows mark key support just below 36. Watch these levels for breaks that could signal a reversal of the three month uptrend.

Click this image for a live chart
The first indicator window shows RSI holding the 40-50 support zone during this uptrend. A break below 40 would turn RSI (momentum), bearish. Put another way, such a move would signal enough selling pressure to warrant a trend change. The bottom window shows the price relative (XME:SPY ratio) flattening out the last six weeks. Even though XME moved higher during this timeframe, it did not outperform and did not show upside leadership. A breakout here is needed to signal relative strength. Otherwise, a downturn and break below the September lows would signal a return to relative weakness.
Good trading and good weekend!
Arthur Hill CMT

About the author:
Arthur Hill, CMT, is the Chief Technical Strategist at TrendInvestorPro.com. Focusing predominantly on US equities and ETFs, his systematic approach of identifying trend, finding signals within the trend, and setting key price levels has made him an esteemed market technician. Arthur has written articles for numerous financial publications including Barrons and Stocks & Commodities Magazine. In addition to his Chartered Market Technician (CMT) designation, he holds an MBA from the Cass Business School at City University in London.
Learn More


