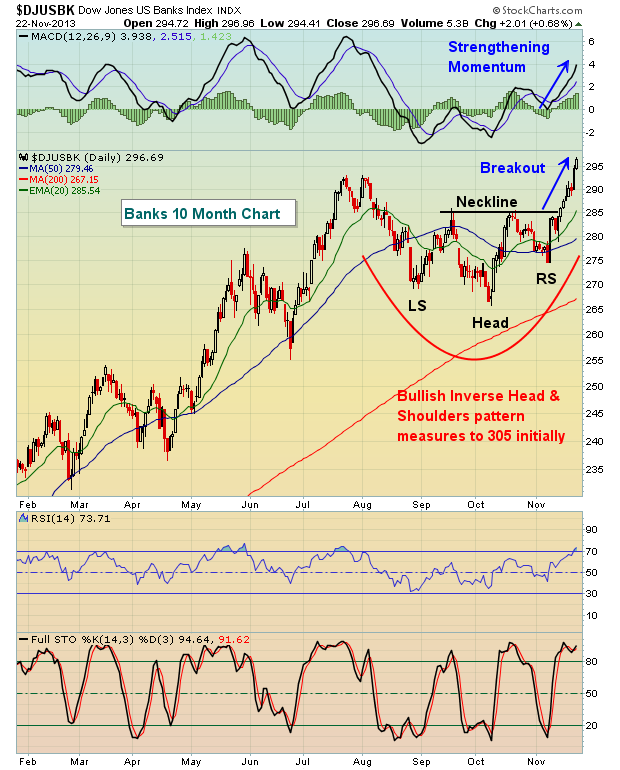
I rarely question a market move to the upside when banks are leading the charge. And if you're wondering how the banks performed last week as the S&P 500 broke to a fresh all-time high, check out the Dow Jones US Bank Index chart:
Banks consolidated since late summer while money rotated to other areas of the market, like industrials. Over just the past three months, industrials have outperformed financials, gaining 12.1% while financials have risen just 7.6%. Banks have been even weaker, rising just above 5.0% over the past three months. But technically, that all changed over the past couple weeks. Banks, while underperforming, had been consolidating in a very bullish inverse head & shoulders continuation pattern. That pattern broke to the upside - as expected - and suggests this current rally has further to run.
In addition, the small cap Russell 2000 index had lagged for the past several weeks. But surprisingly, just as the Fed minutes were released on Wednesday, and tapering was back on the table, small caps began outperforming. From Wednesday's low through Friday's close, our major indices performed as follows:
Russell 2000: +2.60%
NASDAQ: +2.05%
S&P 500: +1.55%
Dow Jones: +1.26%
2-3 days do not constitute a trend, but it's at least suggests the possibility that traders have moved back to a "risk on" mode, a mode that generally accompanies sustainable market advances. Given the release of the Fed minutes showing that tapering is back on the table, this is not the response I would have expected from the market. If anything, this is suggesting that the ultimate tapering may not have the negative impact that many are expecting. After all, if the Fed's candy store (quantitative easing) helped lead the equity markets higher, it only makes sense that closing the candy store will have the opposite effect, right? Well, maybe not. Improving economic conditions may trump the ultimate tapering of asset purchases. And money flowing into riskier asset classes is all the proof I need - at least until it changes.
One last thing. The Russell 2000 closed at an all-time high on Friday after lagging its larger counterparts since early- to mid-October. This breakout is occurring just as we approach December, the strongest month historically for small caps since 1988. The average annualized return for the Russell 2000 during the month of December over the past 25 years is 43.25%, more than double any other calendar month.
That leads me to feature one small cap stock as my Chart of the Day for Monday, November 25th. It recently posted quarterly earnings that handily beat both top line and bottom line Wall Street estimates. That earnings report resulted in a powerful, breakaway gap on massive volume that could result in significant gains in the weeks ahead. If you'd like more information, CLICK HERE


