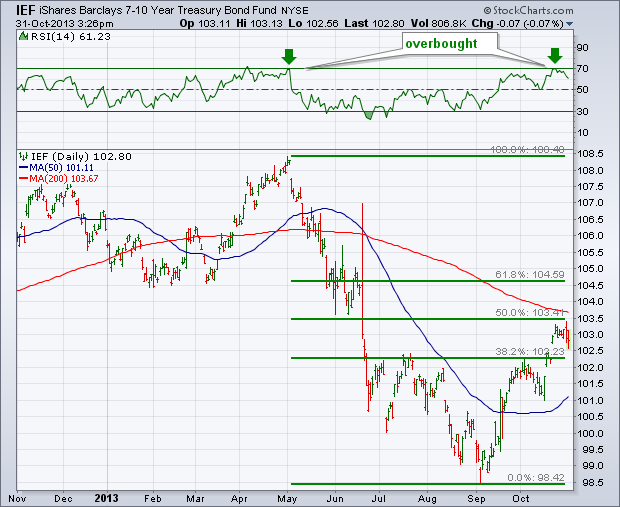
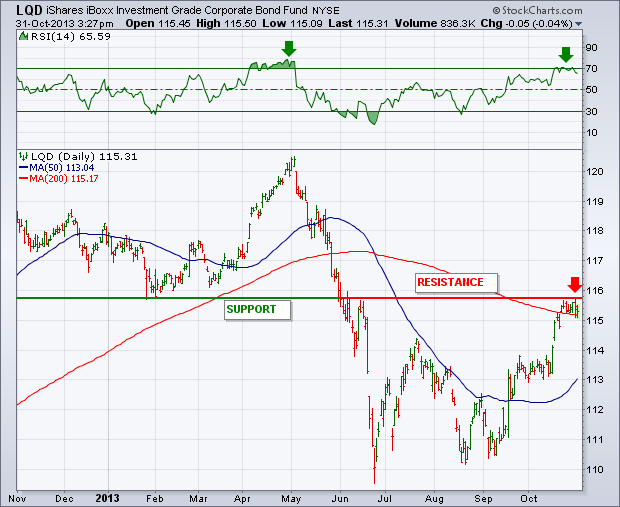
After selling off sharply between May and September, bond prices have been bouncing for the last two months. The bounce, however, has reached technical levels that may cap the rally. Chart 1 shows the 7-10 Year T Bond iShares (IEF) having retraced 50% of its previous downtrend. In addition, the IEF is up against its 200-day moving average. The green line above the chart also shows the 14-day RSI line having reached overbought territory at 70 for the first time since April. Chart 2 shows a similar trend for the iBoxx Investment Grade Corporate Bond iShares (LQD). Chart 2 shows that the LQD has reached potential chart resistance formed earlier in the year. Notice that the horizontal line drawn below the first quarter lows turned from green to red. That's because a broken "support" level becomes a new "resistance" level after it's broken. Its 14-day RSI line has also reached overbought territory at 70 (down arrows).


